Immigrants from Ghana vs Immigrants from Malaysia Disability
COMPARE
Immigrants from Ghana
Immigrants from Malaysia
Disability
Disability Comparison
Immigrants from Ghana
Immigrants from Malaysia
11.6%
DISABILITY
71.2/ 100
METRIC RATING
153rd/ 347
METRIC RANK
10.6%
DISABILITY
100.0/ 100
METRIC RATING
25th/ 347
METRIC RANK
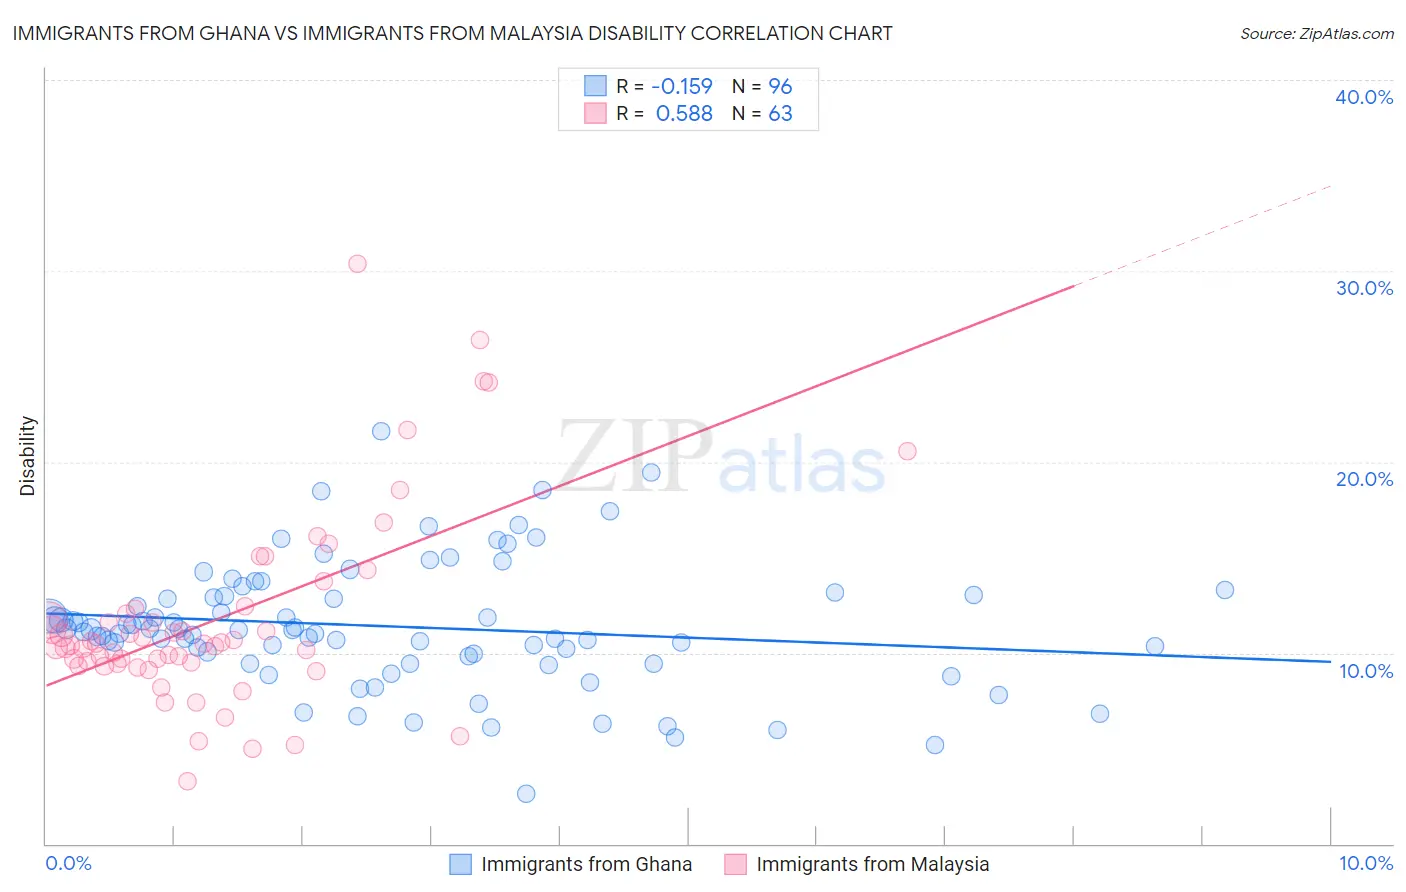
Immigrants from Ghana vs Immigrants from Malaysia Disability Correlation Chart
The statistical analysis conducted on geographies consisting of 199,930,208 people shows a poor negative correlation between the proportion of Immigrants from Ghana and percentage of population with a disability in the United States with a correlation coefficient (R) of -0.159 and weighted average of 11.6%. Similarly, the statistical analysis conducted on geographies consisting of 197,973,684 people shows a substantial positive correlation between the proportion of Immigrants from Malaysia and percentage of population with a disability in the United States with a correlation coefficient (R) of 0.588 and weighted average of 10.6%, a difference of 9.5%.
Disability Correlation Summary
| Measurement | Immigrants from Ghana | Immigrants from Malaysia |
| Minimum | 2.6% | 3.3% |
| Maximum | 21.6% | 30.4% |
| Range | 19.0% | 27.1% |
| Mean | 11.4% | 11.8% |
| Median | 11.2% | 10.5% |
| Interquartile 25% (IQ1) | 9.9% | 9.4% |
| Interquartile 75% (IQ3) | 13.0% | 12.3% |
| Interquartile Range (IQR) | 3.1% | 2.9% |
| Standard Deviation (Sample) | 3.3% | 5.1% |
| Standard Deviation (Population) | 3.3% | 5.1% |
Similar Demographics by Disability
Demographics Similar to Immigrants from Ghana by Disability
In terms of disability, the demographic groups most similar to Immigrants from Ghana are Immigrants from Guatemala (11.6%, a difference of 0.0%), Immigrants from Kenya (11.6%, a difference of 0.050%), Immigrants from Moldova (11.6%, a difference of 0.050%), Romanian (11.6%, a difference of 0.080%), and Immigrants from Netherlands (11.6%, a difference of 0.080%).
| Demographics | Rating | Rank | Disability |
| Immigrants | Hungary | 79.0 /100 | #146 | Good 11.5% |
| Immigrants | Ukraine | 77.6 /100 | #147 | Good 11.5% |
| Sudanese | 77.1 /100 | #148 | Good 11.5% |
| Immigrants | Norway | 73.2 /100 | #149 | Good 11.6% |
| Romanians | 72.7 /100 | #150 | Good 11.6% |
| Immigrants | Kenya | 72.1 /100 | #151 | Good 11.6% |
| Immigrants | Moldova | 72.0 /100 | #152 | Good 11.6% |
| Immigrants | Ghana | 71.2 /100 | #153 | Good 11.6% |
| Immigrants | Guatemala | 71.1 /100 | #154 | Good 11.6% |
| Immigrants | Netherlands | 69.8 /100 | #155 | Good 11.6% |
| Immigrants | Fiji | 69.5 /100 | #156 | Good 11.6% |
| Immigrants | Middle Africa | 69.5 /100 | #157 | Good 11.6% |
| Armenians | 65.9 /100 | #158 | Good 11.6% |
| Guatemalans | 65.1 /100 | #159 | Good 11.6% |
| Immigrants | Barbados | 64.2 /100 | #160 | Good 11.6% |
Demographics Similar to Immigrants from Malaysia by Disability
In terms of disability, the demographic groups most similar to Immigrants from Malaysia are Argentinean (10.6%, a difference of 0.050%), Cypriot (10.6%, a difference of 0.060%), Egyptian (10.6%, a difference of 0.19%), Immigrants from Argentina (10.6%, a difference of 0.31%), and Venezuelan (10.5%, a difference of 0.38%).
| Demographics | Rating | Rank | Disability |
| Burmese | 100.0 /100 | #18 | Exceptional 10.4% |
| Immigrants | Pakistan | 100.0 /100 | #19 | Exceptional 10.4% |
| Immigrants | Venezuela | 100.0 /100 | #20 | Exceptional 10.4% |
| Asians | 100.0 /100 | #21 | Exceptional 10.4% |
| Immigrants | Sri Lanka | 100.0 /100 | #22 | Exceptional 10.5% |
| Immigrants | Asia | 100.0 /100 | #23 | Exceptional 10.5% |
| Venezuelans | 100.0 /100 | #24 | Exceptional 10.5% |
| Immigrants | Malaysia | 100.0 /100 | #25 | Exceptional 10.6% |
| Argentineans | 100.0 /100 | #26 | Exceptional 10.6% |
| Cypriots | 100.0 /100 | #27 | Exceptional 10.6% |
| Egyptians | 100.0 /100 | #28 | Exceptional 10.6% |
| Immigrants | Argentina | 100.0 /100 | #29 | Exceptional 10.6% |
| Immigrants | Turkey | 100.0 /100 | #30 | Exceptional 10.6% |
| Immigrants | Egypt | 100.0 /100 | #31 | Exceptional 10.6% |
| Paraguayans | 100.0 /100 | #32 | Exceptional 10.6% |