Immigrants from Denmark vs Immigrants from Malaysia Disability
COMPARE
Immigrants from Denmark
Immigrants from Malaysia
Disability
Disability Comparison
Immigrants from Denmark
Immigrants from Malaysia
11.3%
DISABILITY
95.6/ 100
METRIC RATING
110th/ 347
METRIC RANK
10.6%
DISABILITY
100.0/ 100
METRIC RATING
25th/ 347
METRIC RANK
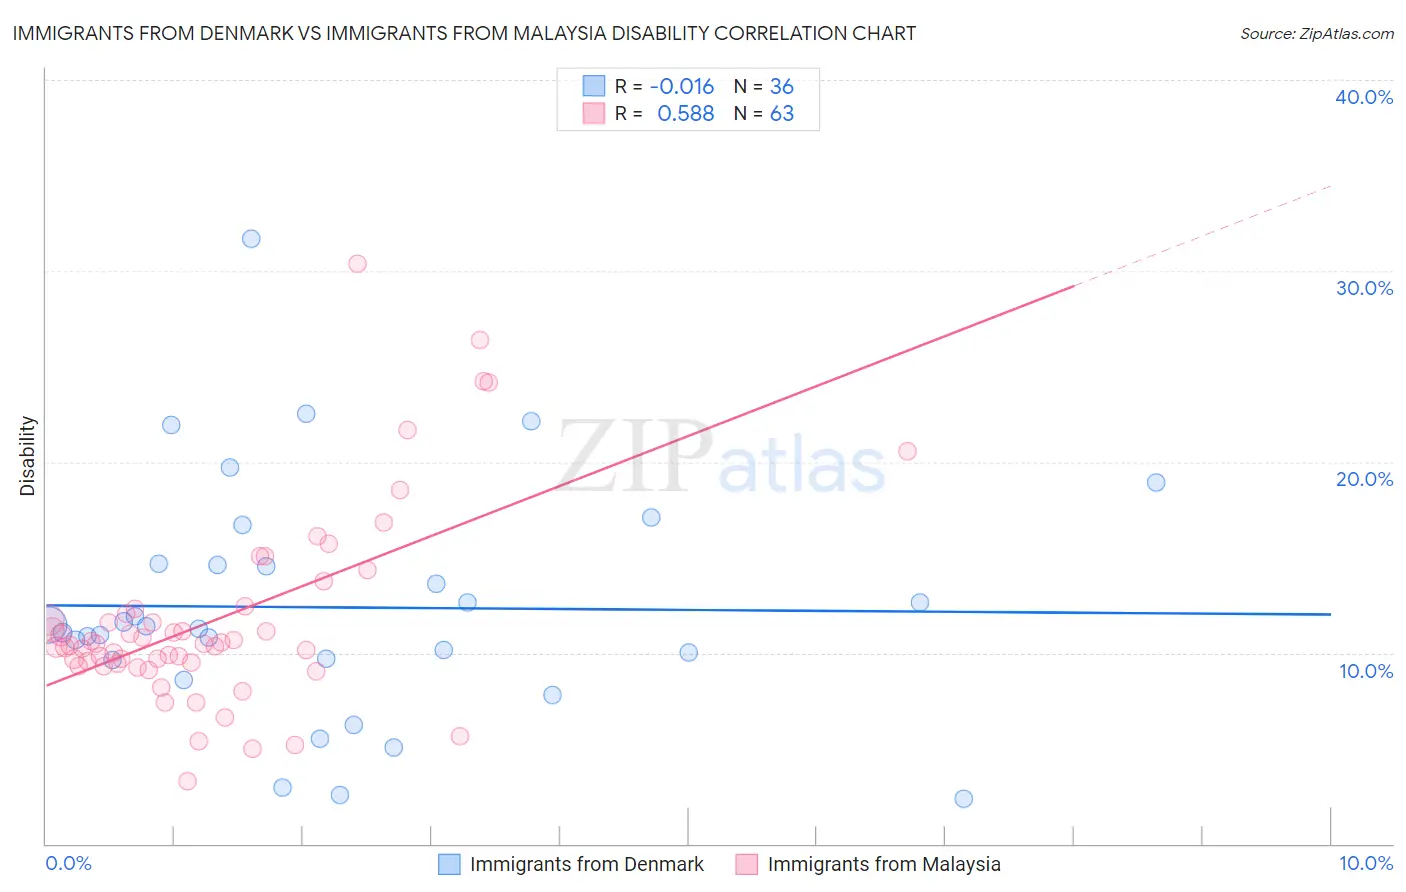
Immigrants from Denmark vs Immigrants from Malaysia Disability Correlation Chart
The statistical analysis conducted on geographies consisting of 136,432,465 people shows no correlation between the proportion of Immigrants from Denmark and percentage of population with a disability in the United States with a correlation coefficient (R) of -0.016 and weighted average of 11.3%. Similarly, the statistical analysis conducted on geographies consisting of 197,973,684 people shows a substantial positive correlation between the proportion of Immigrants from Malaysia and percentage of population with a disability in the United States with a correlation coefficient (R) of 0.588 and weighted average of 10.6%, a difference of 6.8%.
Disability Correlation Summary
| Measurement | Immigrants from Denmark | Immigrants from Malaysia |
| Minimum | 2.4% | 3.3% |
| Maximum | 31.7% | 30.4% |
| Range | 29.3% | 27.1% |
| Mean | 12.4% | 11.8% |
| Median | 11.3% | 10.5% |
| Interquartile 25% (IQ1) | 9.6% | 9.4% |
| Interquartile 75% (IQ3) | 14.7% | 12.3% |
| Interquartile Range (IQR) | 5.0% | 2.9% |
| Standard Deviation (Sample) | 6.1% | 5.1% |
| Standard Deviation (Population) | 6.0% | 5.1% |
Similar Demographics by Disability
Demographics Similar to Immigrants from Denmark by Disability
In terms of disability, the demographic groups most similar to Immigrants from Denmark are Immigrants from Uganda (11.3%, a difference of 0.020%), Immigrants from South Eastern Asia (11.3%, a difference of 0.070%), Immigrants from Nigeria (11.3%, a difference of 0.10%), Nicaraguan (11.3%, a difference of 0.18%), and Immigrants from Uzbekistan (11.3%, a difference of 0.18%).
| Demographics | Rating | Rank | Disability |
| Immigrants | Uruguay | 96.4 /100 | #103 | Exceptional 11.3% |
| Immigrants | Immigrants | 96.4 /100 | #104 | Exceptional 11.3% |
| Immigrants | Kazakhstan | 96.4 /100 | #105 | Exceptional 11.3% |
| Immigrants | Eastern Europe | 96.3 /100 | #106 | Exceptional 11.3% |
| Nicaraguans | 96.2 /100 | #107 | Exceptional 11.3% |
| Immigrants | Nigeria | 96.0 /100 | #108 | Exceptional 11.3% |
| Immigrants | Uganda | 95.7 /100 | #109 | Exceptional 11.3% |
| Immigrants | Denmark | 95.6 /100 | #110 | Exceptional 11.3% |
| Immigrants | South Eastern Asia | 95.4 /100 | #111 | Exceptional 11.3% |
| Immigrants | Uzbekistan | 94.9 /100 | #112 | Exceptional 11.3% |
| Guyanese | 94.7 /100 | #113 | Exceptional 11.3% |
| Immigrants | Syria | 94.7 /100 | #114 | Exceptional 11.3% |
| Immigrants | Philippines | 94.6 /100 | #115 | Exceptional 11.3% |
| Immigrants | Northern Europe | 94.1 /100 | #116 | Exceptional 11.3% |
| Luxembourgers | 93.9 /100 | #117 | Exceptional 11.3% |
Demographics Similar to Immigrants from Malaysia by Disability
In terms of disability, the demographic groups most similar to Immigrants from Malaysia are Argentinean (10.6%, a difference of 0.050%), Cypriot (10.6%, a difference of 0.060%), Egyptian (10.6%, a difference of 0.19%), Immigrants from Argentina (10.6%, a difference of 0.31%), and Venezuelan (10.5%, a difference of 0.38%).
| Demographics | Rating | Rank | Disability |
| Burmese | 100.0 /100 | #18 | Exceptional 10.4% |
| Immigrants | Pakistan | 100.0 /100 | #19 | Exceptional 10.4% |
| Immigrants | Venezuela | 100.0 /100 | #20 | Exceptional 10.4% |
| Asians | 100.0 /100 | #21 | Exceptional 10.4% |
| Immigrants | Sri Lanka | 100.0 /100 | #22 | Exceptional 10.5% |
| Immigrants | Asia | 100.0 /100 | #23 | Exceptional 10.5% |
| Venezuelans | 100.0 /100 | #24 | Exceptional 10.5% |
| Immigrants | Malaysia | 100.0 /100 | #25 | Exceptional 10.6% |
| Argentineans | 100.0 /100 | #26 | Exceptional 10.6% |
| Cypriots | 100.0 /100 | #27 | Exceptional 10.6% |
| Egyptians | 100.0 /100 | #28 | Exceptional 10.6% |
| Immigrants | Argentina | 100.0 /100 | #29 | Exceptional 10.6% |
| Immigrants | Turkey | 100.0 /100 | #30 | Exceptional 10.6% |
| Immigrants | Egypt | 100.0 /100 | #31 | Exceptional 10.6% |
| Paraguayans | 100.0 /100 | #32 | Exceptional 10.6% |