Immigrants from Mexico vs Immigrants from Bangladesh Ambulatory Disability
COMPARE
Immigrants from Mexico
Immigrants from Bangladesh
Ambulatory Disability
Ambulatory Disability Comparison
Immigrants from Mexico
Immigrants from Bangladesh
6.3%
AMBULATORY DISABILITY
11.0/ 100
METRIC RATING
214th/ 347
METRIC RANK
6.2%
AMBULATORY DISABILITY
24.6/ 100
METRIC RATING
198th/ 347
METRIC RANK
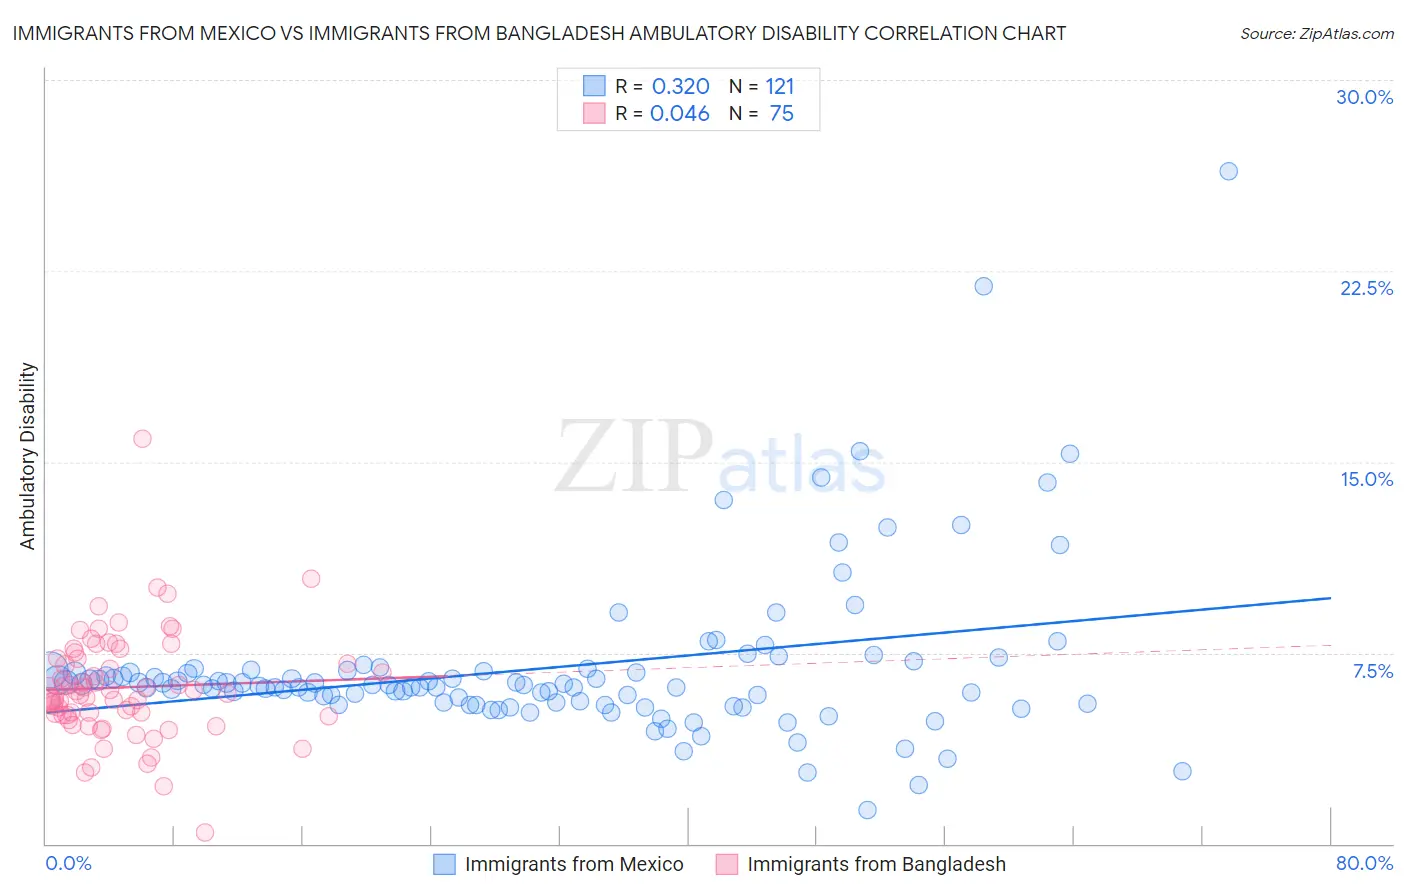
Immigrants from Mexico vs Immigrants from Bangladesh Ambulatory Disability Correlation Chart
The statistical analysis conducted on geographies consisting of 513,370,670 people shows a mild positive correlation between the proportion of Immigrants from Mexico and percentage of population with ambulatory disability in the United States with a correlation coefficient (R) of 0.320 and weighted average of 6.3%. Similarly, the statistical analysis conducted on geographies consisting of 203,637,177 people shows no correlation between the proportion of Immigrants from Bangladesh and percentage of population with ambulatory disability in the United States with a correlation coefficient (R) of 0.046 and weighted average of 6.2%, a difference of 1.3%.
Ambulatory Disability Correlation Summary
| Measurement | Immigrants from Mexico | Immigrants from Bangladesh |
| Minimum | 1.3% | 0.46% |
| Maximum | 26.4% | 15.9% |
| Range | 25.1% | 15.4% |
| Mean | 6.9% | 6.1% |
| Median | 6.2% | 5.9% |
| Interquartile 25% (IQ1) | 5.5% | 5.1% |
| Interquartile 75% (IQ3) | 6.8% | 7.3% |
| Interquartile Range (IQR) | 1.3% | 2.2% |
| Standard Deviation (Sample) | 3.3% | 2.1% |
| Standard Deviation (Population) | 3.3% | 2.1% |
Demographics Similar to Immigrants from Mexico and Immigrants from Bangladesh by Ambulatory Disability
In terms of ambulatory disability, the demographic groups most similar to Immigrants from Mexico are Immigrants from Latin America (6.3%, a difference of 0.010%), Canadian (6.3%, a difference of 0.020%), Mexican American Indian (6.3%, a difference of 0.12%), Japanese (6.3%, a difference of 0.12%), and Samoan (6.3%, a difference of 0.13%). Similarly, the demographic groups most similar to Immigrants from Bangladesh are Polish (6.2%, a difference of 0.12%), Italian (6.2%, a difference of 0.14%), Immigrants from Cambodia (6.2%, a difference of 0.22%), Malaysian (6.2%, a difference of 0.25%), and Immigrants from Central America (6.2%, a difference of 0.34%).
| Demographics | Rating | Rank | Ambulatory Disability |
| Malaysians | 28.2 /100 | #196 | Fair 6.2% |
| Poles | 26.3 /100 | #197 | Fair 6.2% |
| Immigrants | Bangladesh | 24.6 /100 | #198 | Fair 6.2% |
| Italians | 22.6 /100 | #199 | Fair 6.2% |
| Immigrants | Cambodia | 21.5 /100 | #200 | Fair 6.2% |
| Immigrants | Central America | 20.1 /100 | #201 | Fair 6.2% |
| Albanians | 19.7 /100 | #202 | Poor 6.2% |
| Immigrants | Ukraine | 18.4 /100 | #203 | Poor 6.2% |
| Immigrants | Congo | 18.2 /100 | #204 | Poor 6.2% |
| Slovenes | 18.0 /100 | #205 | Poor 6.2% |
| Finns | 17.2 /100 | #206 | Poor 6.2% |
| Alsatians | 15.1 /100 | #207 | Poor 6.3% |
| Bangladeshis | 14.2 /100 | #208 | Poor 6.3% |
| Immigrants | Iraq | 14.0 /100 | #209 | Poor 6.3% |
| Immigrants | Laos | 13.2 /100 | #210 | Poor 6.3% |
| Samoans | 12.1 /100 | #211 | Poor 6.3% |
| Mexican American Indians | 12.0 /100 | #212 | Poor 6.3% |
| Japanese | 12.0 /100 | #213 | Poor 6.3% |
| Immigrants | Mexico | 11.0 /100 | #214 | Poor 6.3% |
| Immigrants | Latin America | 11.0 /100 | #215 | Poor 6.3% |
| Canadians | 10.9 /100 | #216 | Poor 6.3% |