Tongan vs Immigrants from Bangladesh Ambulatory Disability
COMPARE
Tongan
Immigrants from Bangladesh
Ambulatory Disability
Ambulatory Disability Comparison
Tongans
Immigrants from Bangladesh
5.4%
AMBULATORY DISABILITY
100.0/ 100
METRIC RATING
23rd/ 347
METRIC RANK
6.2%
AMBULATORY DISABILITY
24.6/ 100
METRIC RATING
198th/ 347
METRIC RANK
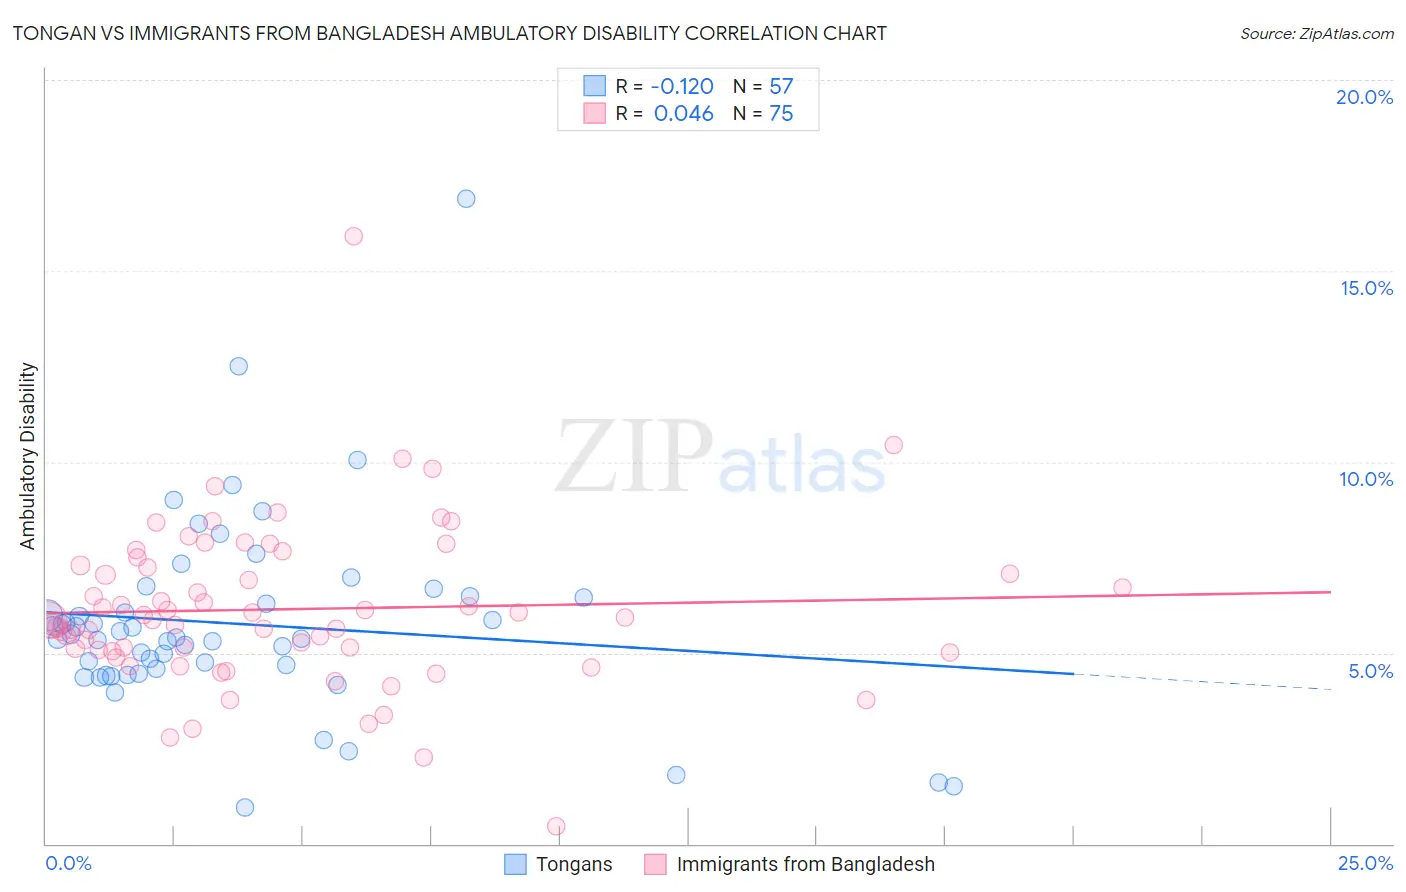
Tongan vs Immigrants from Bangladesh Ambulatory Disability Correlation Chart
The statistical analysis conducted on geographies consisting of 102,876,651 people shows a poor negative correlation between the proportion of Tongans and percentage of population with ambulatory disability in the United States with a correlation coefficient (R) of -0.120 and weighted average of 5.4%. Similarly, the statistical analysis conducted on geographies consisting of 203,637,177 people shows no correlation between the proportion of Immigrants from Bangladesh and percentage of population with ambulatory disability in the United States with a correlation coefficient (R) of 0.046 and weighted average of 6.2%, a difference of 15.3%.
Ambulatory Disability Correlation Summary
| Measurement | Tongan | Immigrants from Bangladesh |
| Minimum | 0.94% | 0.46% |
| Maximum | 16.9% | 15.9% |
| Range | 16.0% | 15.4% |
| Mean | 5.8% | 6.1% |
| Median | 5.4% | 5.9% |
| Interquartile 25% (IQ1) | 4.5% | 5.1% |
| Interquartile 75% (IQ3) | 6.5% | 7.3% |
| Interquartile Range (IQR) | 1.9% | 2.2% |
| Standard Deviation (Sample) | 2.5% | 2.1% |
| Standard Deviation (Population) | 2.5% | 2.1% |
Similar Demographics by Ambulatory Disability
Demographics Similar to Tongans by Ambulatory Disability
In terms of ambulatory disability, the demographic groups most similar to Tongans are Immigrants from Israel (5.4%, a difference of 0.040%), Immigrants from Saudi Arabia (5.4%, a difference of 0.090%), Zimbabwean (5.4%, a difference of 0.17%), Immigrants from Nepal (5.4%, a difference of 0.20%), and Asian (5.4%, a difference of 0.36%).
| Demographics | Rating | Rank | Ambulatory Disability |
| Immigrants | Hong Kong | 100.0 /100 | #16 | Exceptional 5.3% |
| Immigrants | Ethiopia | 100.0 /100 | #17 | Exceptional 5.4% |
| Immigrants | Sri Lanka | 100.0 /100 | #18 | Exceptional 5.4% |
| Indians (Asian) | 100.0 /100 | #19 | Exceptional 5.4% |
| Ethiopians | 100.0 /100 | #20 | Exceptional 5.4% |
| Immigrants | Kuwait | 100.0 /100 | #21 | Exceptional 5.4% |
| Immigrants | Israel | 100.0 /100 | #22 | Exceptional 5.4% |
| Tongans | 100.0 /100 | #23 | Exceptional 5.4% |
| Immigrants | Saudi Arabia | 100.0 /100 | #24 | Exceptional 5.4% |
| Zimbabweans | 100.0 /100 | #25 | Exceptional 5.4% |
| Immigrants | Nepal | 100.0 /100 | #26 | Exceptional 5.4% |
| Asians | 100.0 /100 | #27 | Exceptional 5.4% |
| Cambodians | 100.0 /100 | #28 | Exceptional 5.4% |
| Immigrants | Iran | 100.0 /100 | #29 | Exceptional 5.4% |
| Immigrants | Turkey | 100.0 /100 | #30 | Exceptional 5.4% |
Demographics Similar to Immigrants from Bangladesh by Ambulatory Disability
In terms of ambulatory disability, the demographic groups most similar to Immigrants from Bangladesh are Polish (6.2%, a difference of 0.12%), Italian (6.2%, a difference of 0.14%), Immigrants from Cambodia (6.2%, a difference of 0.22%), Malaysian (6.2%, a difference of 0.25%), and Belgian (6.2%, a difference of 0.27%).
| Demographics | Rating | Rank | Ambulatory Disability |
| Immigrants | Guatemala | 31.9 /100 | #191 | Fair 6.2% |
| Immigrants | Western Europe | 31.6 /100 | #192 | Fair 6.2% |
| Guatemalans | 30.0 /100 | #193 | Fair 6.2% |
| Alaska Natives | 29.8 /100 | #194 | Fair 6.2% |
| Belgians | 28.6 /100 | #195 | Fair 6.2% |
| Malaysians | 28.2 /100 | #196 | Fair 6.2% |
| Poles | 26.3 /100 | #197 | Fair 6.2% |
| Immigrants | Bangladesh | 24.6 /100 | #198 | Fair 6.2% |
| Italians | 22.6 /100 | #199 | Fair 6.2% |
| Immigrants | Cambodia | 21.5 /100 | #200 | Fair 6.2% |
| Immigrants | Central America | 20.1 /100 | #201 | Fair 6.2% |
| Albanians | 19.7 /100 | #202 | Poor 6.2% |
| Immigrants | Ukraine | 18.4 /100 | #203 | Poor 6.2% |
| Immigrants | Congo | 18.2 /100 | #204 | Poor 6.2% |
| Slovenes | 18.0 /100 | #205 | Poor 6.2% |