Immigrants from Mexico vs Immigrants from Bangladesh Unemployment Among Women with Children Under 18 years
COMPARE
Immigrants from Mexico
Immigrants from Bangladesh
Unemployment Among Women with Children Under 18 years
Unemployment Among Women with Children Under 18 years Comparison
Immigrants from Mexico
Immigrants from Bangladesh
6.6%
UNEMPLOYMENT AMONG WOMEN WITH CHILDREN UNDER 18 YEARS
0.0/ 100
METRIC RATING
312th/ 347
METRIC RANK
6.4%
UNEMPLOYMENT AMONG WOMEN WITH CHILDREN UNDER 18 YEARS
0.0/ 100
METRIC RATING
293rd/ 347
METRIC RANK
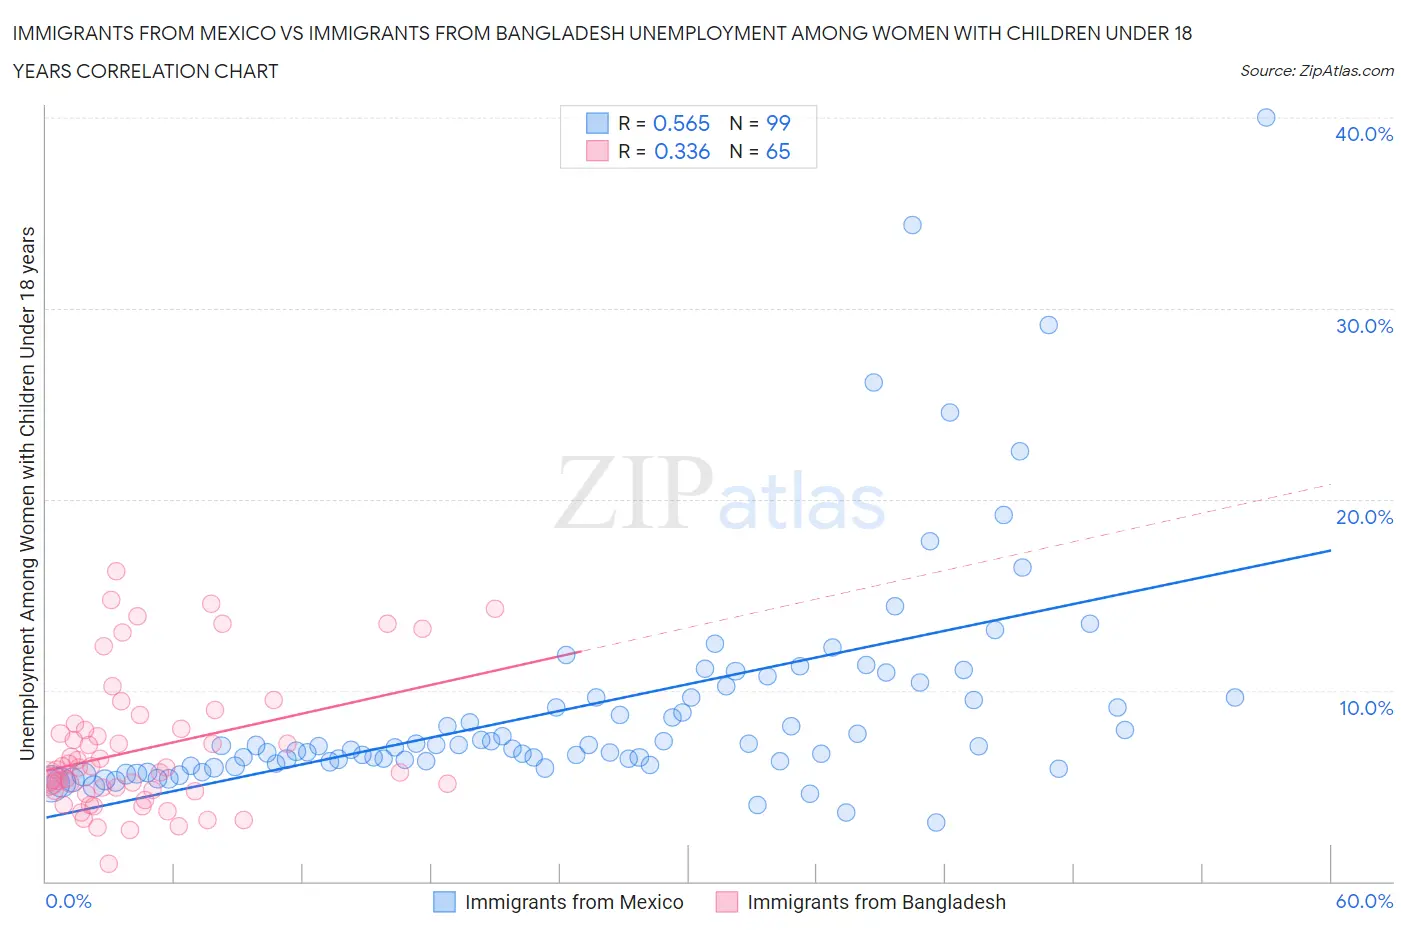
Immigrants from Mexico vs Immigrants from Bangladesh Unemployment Among Women with Children Under 18 years Correlation Chart
The statistical analysis conducted on geographies consisting of 478,971,563 people shows a substantial positive correlation between the proportion of Immigrants from Mexico and unemployment rate among women with children under the age of 18 in the United States with a correlation coefficient (R) of 0.565 and weighted average of 6.6%. Similarly, the statistical analysis conducted on geographies consisting of 201,017,496 people shows a mild positive correlation between the proportion of Immigrants from Bangladesh and unemployment rate among women with children under the age of 18 in the United States with a correlation coefficient (R) of 0.336 and weighted average of 6.4%, a difference of 3.2%.
Unemployment Among Women with Children Under 18 years Correlation Summary
| Measurement | Immigrants from Mexico | Immigrants from Bangladesh |
| Minimum | 3.1% | 0.90% |
| Maximum | 40.0% | 16.2% |
| Range | 36.9% | 15.3% |
| Mean | 9.2% | 6.9% |
| Median | 7.1% | 6.0% |
| Interquartile 25% (IQ1) | 6.2% | 4.7% |
| Interquartile 75% (IQ3) | 9.6% | 8.1% |
| Interquartile Range (IQR) | 3.4% | 3.4% |
| Standard Deviation (Sample) | 6.1% | 3.5% |
| Standard Deviation (Population) | 6.1% | 3.5% |
Demographics Similar to Immigrants from Mexico and Immigrants from Bangladesh by Unemployment Among Women with Children Under 18 years
In terms of unemployment among women with children under 18 years, the demographic groups most similar to Immigrants from Mexico are Yaqui (6.6%, a difference of 0.090%), Guyanese (6.6%, a difference of 0.39%), Ecuadorian (6.5%, a difference of 0.63%), African (6.5%, a difference of 0.72%), and Belizean (6.5%, a difference of 0.94%). Similarly, the demographic groups most similar to Immigrants from Bangladesh are Mexican (6.4%, a difference of 0.030%), Honduran (6.4%, a difference of 0.030%), Barbadian (6.4%, a difference of 0.11%), Haitian (6.4%, a difference of 0.13%), and Immigrants from Senegal (6.4%, a difference of 0.17%).
| Demographics | Rating | Rank | Unemployment Among Women with Children Under 18 years |
| Mexicans | 0.0 /100 | #292 | Tragic 6.4% |
| Immigrants | Bangladesh | 0.0 /100 | #293 | Tragic 6.4% |
| Hondurans | 0.0 /100 | #294 | Tragic 6.4% |
| Barbadians | 0.0 /100 | #295 | Tragic 6.4% |
| Haitians | 0.0 /100 | #296 | Tragic 6.4% |
| Immigrants | Senegal | 0.0 /100 | #297 | Tragic 6.4% |
| Immigrants | Latin America | 0.0 /100 | #298 | Tragic 6.4% |
| Jamaicans | 0.0 /100 | #299 | Tragic 6.4% |
| Immigrants | Jamaica | 0.0 /100 | #300 | Tragic 6.4% |
| Immigrants | Haiti | 0.0 /100 | #301 | Tragic 6.4% |
| Immigrants | Armenia | 0.0 /100 | #302 | Tragic 6.5% |
| Immigrants | Honduras | 0.0 /100 | #303 | Tragic 6.5% |
| Vietnamese | 0.0 /100 | #304 | Tragic 6.5% |
| Immigrants | Central America | 0.0 /100 | #305 | Tragic 6.5% |
| Immigrants | Guyana | 0.0 /100 | #306 | Tragic 6.5% |
| Belizeans | 0.0 /100 | #307 | Tragic 6.5% |
| Africans | 0.0 /100 | #308 | Tragic 6.5% |
| Ecuadorians | 0.0 /100 | #309 | Tragic 6.5% |
| Guyanese | 0.0 /100 | #310 | Tragic 6.6% |
| Yaqui | 0.0 /100 | #311 | Tragic 6.6% |
| Immigrants | Mexico | 0.0 /100 | #312 | Tragic 6.6% |