Immigrants from Mexico vs Immigrants from Bangladesh Unemployment Among Ages 65 to 74 years
COMPARE
Immigrants from Mexico
Immigrants from Bangladesh
Unemployment Among Ages 65 to 74 years
Unemployment Among Ages 65 to 74 years Comparison
Immigrants from Mexico
Immigrants from Bangladesh
6.0%
UNEMPLOYMENT AMONG AGES 65 TO 74 YEARS
0.0/ 100
METRIC RATING
322nd/ 347
METRIC RANK
5.9%
UNEMPLOYMENT AMONG AGES 65 TO 74 YEARS
0.0/ 100
METRIC RATING
310th/ 347
METRIC RANK
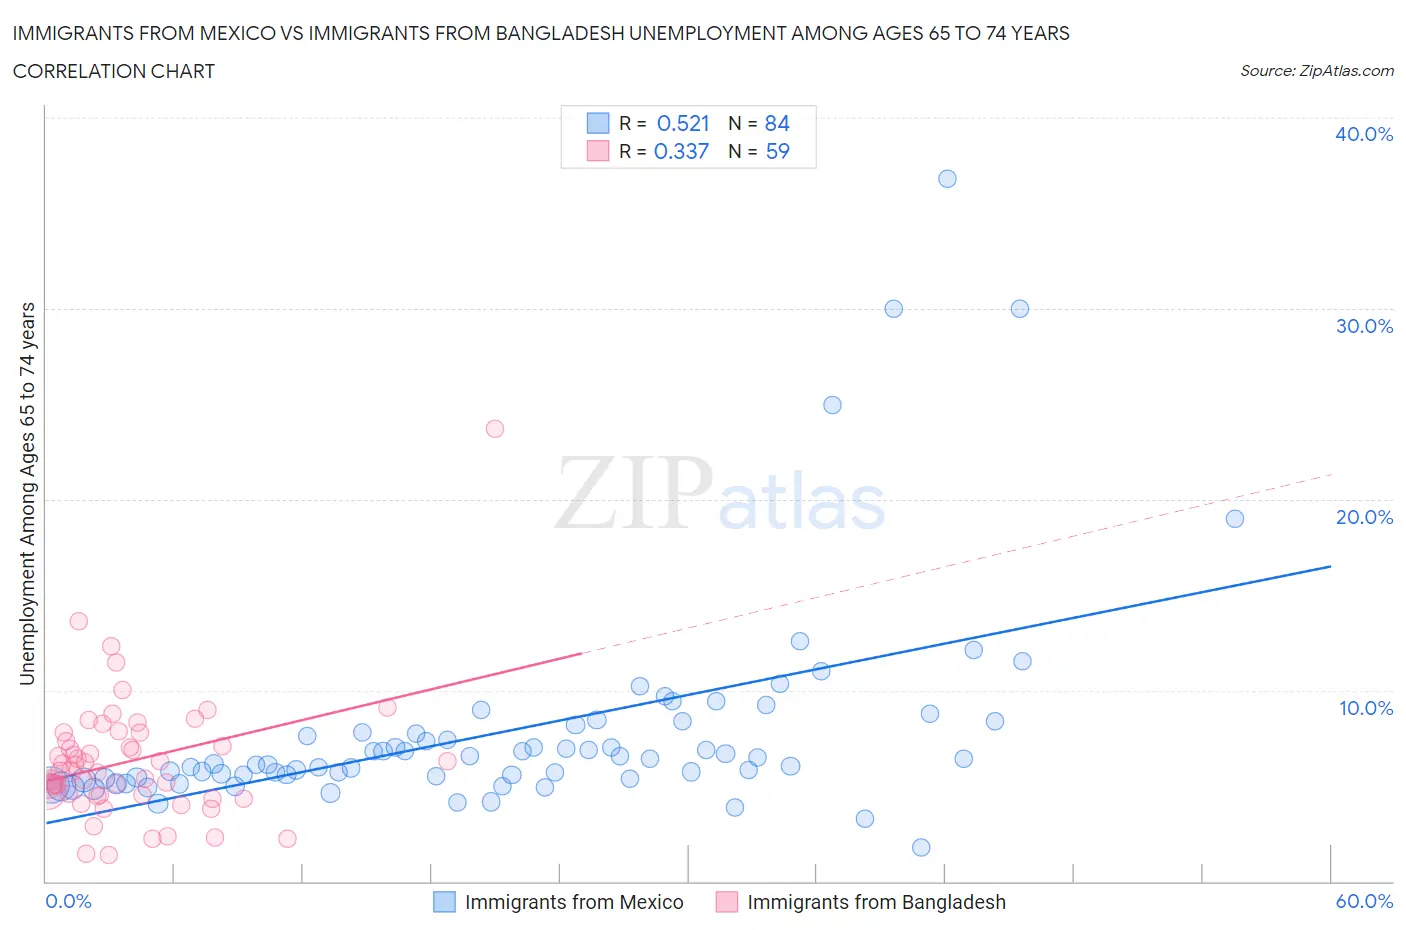
Immigrants from Mexico vs Immigrants from Bangladesh Unemployment Among Ages 65 to 74 years Correlation Chart
The statistical analysis conducted on geographies consisting of 419,156,044 people shows a substantial positive correlation between the proportion of Immigrants from Mexico and unemployment rate among population between the ages 65 and 74 in the United States with a correlation coefficient (R) of 0.521 and weighted average of 6.0%. Similarly, the statistical analysis conducted on geographies consisting of 191,516,845 people shows a mild positive correlation between the proportion of Immigrants from Bangladesh and unemployment rate among population between the ages 65 and 74 in the United States with a correlation coefficient (R) of 0.337 and weighted average of 5.9%, a difference of 2.2%.
Unemployment Among Ages 65 to 74 years Correlation Summary
| Measurement | Immigrants from Mexico | Immigrants from Bangladesh |
| Minimum | 1.8% | 1.4% |
| Maximum | 36.8% | 23.7% |
| Range | 35.0% | 22.3% |
| Mean | 7.9% | 6.3% |
| Median | 6.3% | 5.8% |
| Interquartile 25% (IQ1) | 5.4% | 4.5% |
| Interquartile 75% (IQ3) | 8.0% | 7.8% |
| Interquartile Range (IQR) | 2.6% | 3.3% |
| Standard Deviation (Sample) | 5.7% | 3.4% |
| Standard Deviation (Population) | 5.6% | 3.4% |
Demographics Similar to Immigrants from Mexico and Immigrants from Bangladesh by Unemployment Among Ages 65 to 74 years
In terms of unemployment among ages 65 to 74 years, the demographic groups most similar to Immigrants from Mexico are Delaware (6.0%, a difference of 0.060%), Immigrants from Dominica (6.0%, a difference of 0.22%), Immigrants from Bahamas (5.9%, a difference of 0.59%), Tohono O'odham (6.0%, a difference of 0.63%), and Aleut (5.9%, a difference of 0.68%). Similarly, the demographic groups most similar to Immigrants from Bangladesh are Venezuelan (5.9%, a difference of 0.040%), Hispanic or Latino (5.9%, a difference of 0.060%), Immigrants from Ecuador (5.8%, a difference of 0.14%), Guatemalan (5.8%, a difference of 0.18%), and Vietnamese (5.9%, a difference of 0.25%).
| Demographics | Rating | Rank | Unemployment Among Ages 65 to 74 years |
| Cheyenne | 0.0 /100 | #306 | Tragic 5.8% |
| British West Indians | 0.0 /100 | #307 | Tragic 5.8% |
| Guatemalans | 0.0 /100 | #308 | Tragic 5.8% |
| Immigrants | Ecuador | 0.0 /100 | #309 | Tragic 5.8% |
| Immigrants | Bangladesh | 0.0 /100 | #310 | Tragic 5.9% |
| Venezuelans | 0.0 /100 | #311 | Tragic 5.9% |
| Hispanics or Latinos | 0.0 /100 | #312 | Tragic 5.9% |
| Vietnamese | 0.0 /100 | #313 | Tragic 5.9% |
| Immigrants | Venezuela | 0.0 /100 | #314 | Tragic 5.9% |
| Immigrants | Guatemala | 0.0 /100 | #315 | Tragic 5.9% |
| Immigrants | El Salvador | 0.0 /100 | #316 | Tragic 5.9% |
| Immigrants | Central America | 0.0 /100 | #317 | Tragic 5.9% |
| Zimbabweans | 0.0 /100 | #318 | Tragic 5.9% |
| Aleuts | 0.0 /100 | #319 | Tragic 5.9% |
| Immigrants | Bahamas | 0.0 /100 | #320 | Tragic 5.9% |
| Immigrants | Dominica | 0.0 /100 | #321 | Tragic 6.0% |
| Immigrants | Mexico | 0.0 /100 | #322 | Tragic 6.0% |
| Delaware | 0.0 /100 | #323 | Tragic 6.0% |
| Tohono O'odham | 0.0 /100 | #324 | Tragic 6.0% |
| Immigrants | Portugal | 0.0 /100 | #325 | Tragic 6.0% |
| Natives/Alaskans | 0.0 /100 | #326 | Tragic 6.0% |