French Canadian vs Immigrants from Bangladesh Ambulatory Disability
COMPARE
French Canadian
Immigrants from Bangladesh
Ambulatory Disability
Ambulatory Disability Comparison
French Canadians
Immigrants from Bangladesh
6.7%
AMBULATORY DISABILITY
0.1/ 100
METRIC RATING
272nd/ 347
METRIC RANK
6.2%
AMBULATORY DISABILITY
24.6/ 100
METRIC RATING
198th/ 347
METRIC RANK
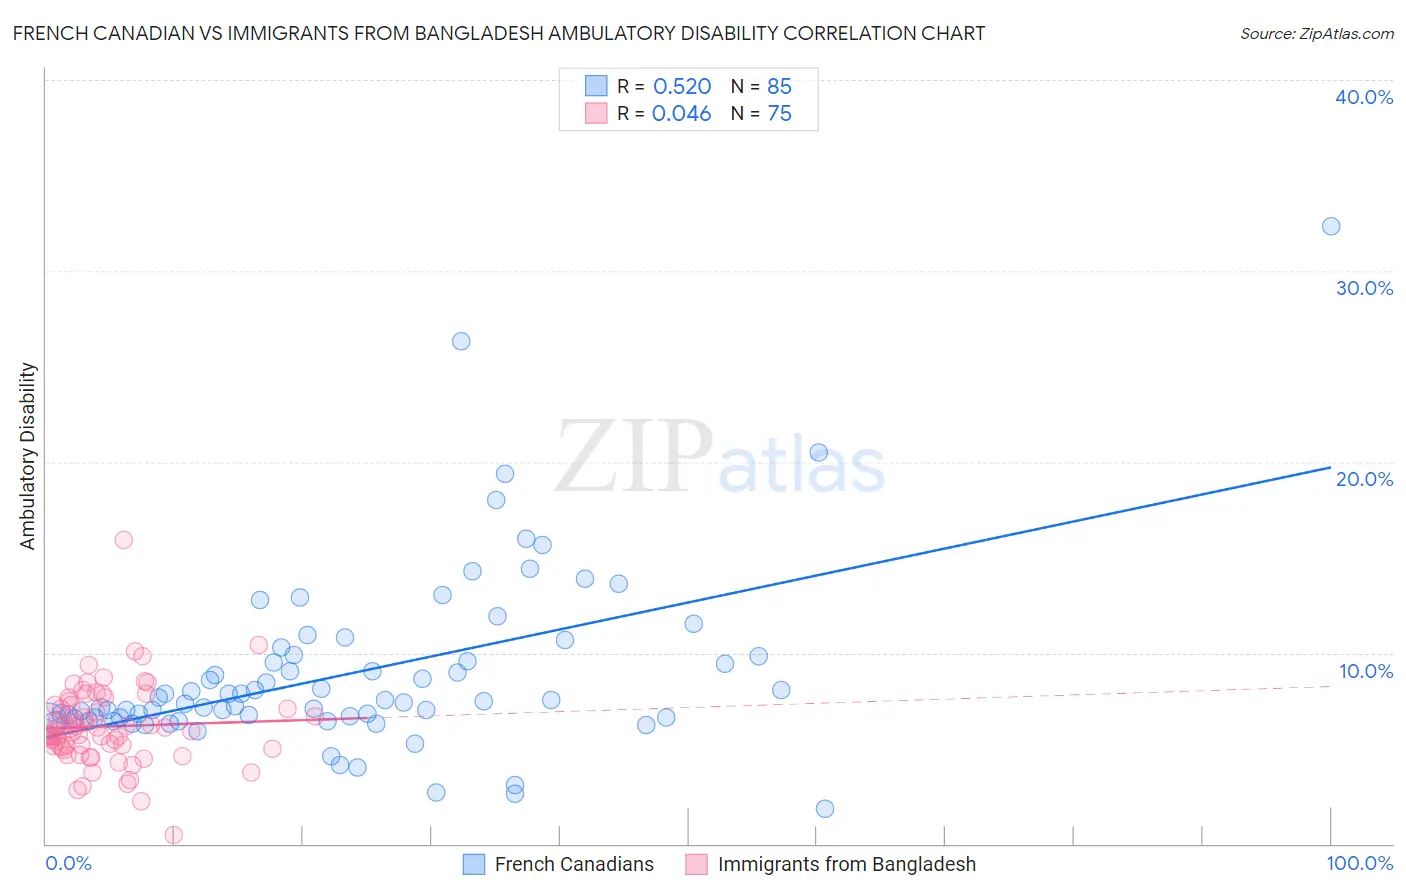
French Canadian vs Immigrants from Bangladesh Ambulatory Disability Correlation Chart
The statistical analysis conducted on geographies consisting of 502,380,239 people shows a substantial positive correlation between the proportion of French Canadians and percentage of population with ambulatory disability in the United States with a correlation coefficient (R) of 0.520 and weighted average of 6.7%. Similarly, the statistical analysis conducted on geographies consisting of 203,637,177 people shows no correlation between the proportion of Immigrants from Bangladesh and percentage of population with ambulatory disability in the United States with a correlation coefficient (R) of 0.046 and weighted average of 6.2%, a difference of 7.7%.
Ambulatory Disability Correlation Summary
| Measurement | French Canadian | Immigrants from Bangladesh |
| Minimum | 1.8% | 0.46% |
| Maximum | 32.4% | 15.9% |
| Range | 30.5% | 15.4% |
| Mean | 9.0% | 6.1% |
| Median | 7.4% | 5.9% |
| Interquartile 25% (IQ1) | 6.6% | 5.1% |
| Interquartile 75% (IQ3) | 9.9% | 7.3% |
| Interquartile Range (IQR) | 3.3% | 2.2% |
| Standard Deviation (Sample) | 4.7% | 2.1% |
| Standard Deviation (Population) | 4.7% | 2.1% |
Similar Demographics by Ambulatory Disability
Demographics Similar to French Canadians by Ambulatory Disability
In terms of ambulatory disability, the demographic groups most similar to French Canadians are White/Caucasian (6.7%, a difference of 0.020%), Sioux (6.7%, a difference of 0.26%), Immigrants from Guyana (6.7%, a difference of 0.32%), Celtic (6.7%, a difference of 0.35%), and Immigrants from Trinidad and Tobago (6.7%, a difference of 0.36%).
| Demographics | Rating | Rank | Ambulatory Disability |
| Bahamians | 0.2 /100 | #265 | Tragic 6.6% |
| Guyanese | 0.2 /100 | #266 | Tragic 6.6% |
| Trinidadians and Tobagonians | 0.2 /100 | #267 | Tragic 6.6% |
| Spanish | 0.2 /100 | #268 | Tragic 6.6% |
| French | 0.1 /100 | #269 | Tragic 6.6% |
| Slovaks | 0.1 /100 | #270 | Tragic 6.7% |
| Immigrants | Trinidad and Tobago | 0.1 /100 | #271 | Tragic 6.7% |
| French Canadians | 0.1 /100 | #272 | Tragic 6.7% |
| Whites/Caucasians | 0.1 /100 | #273 | Tragic 6.7% |
| Sioux | 0.1 /100 | #274 | Tragic 6.7% |
| Immigrants | Guyana | 0.1 /100 | #275 | Tragic 6.7% |
| Celtics | 0.1 /100 | #276 | Tragic 6.7% |
| Jamaicans | 0.1 /100 | #277 | Tragic 6.7% |
| Immigrants | West Indies | 0.1 /100 | #278 | Tragic 6.7% |
| Immigrants | Caribbean | 0.0 /100 | #279 | Tragic 6.7% |
Demographics Similar to Immigrants from Bangladesh by Ambulatory Disability
In terms of ambulatory disability, the demographic groups most similar to Immigrants from Bangladesh are Polish (6.2%, a difference of 0.12%), Italian (6.2%, a difference of 0.14%), Immigrants from Cambodia (6.2%, a difference of 0.22%), Malaysian (6.2%, a difference of 0.25%), and Belgian (6.2%, a difference of 0.27%).
| Demographics | Rating | Rank | Ambulatory Disability |
| Immigrants | Guatemala | 31.9 /100 | #191 | Fair 6.2% |
| Immigrants | Western Europe | 31.6 /100 | #192 | Fair 6.2% |
| Guatemalans | 30.0 /100 | #193 | Fair 6.2% |
| Alaska Natives | 29.8 /100 | #194 | Fair 6.2% |
| Belgians | 28.6 /100 | #195 | Fair 6.2% |
| Malaysians | 28.2 /100 | #196 | Fair 6.2% |
| Poles | 26.3 /100 | #197 | Fair 6.2% |
| Immigrants | Bangladesh | 24.6 /100 | #198 | Fair 6.2% |
| Italians | 22.6 /100 | #199 | Fair 6.2% |
| Immigrants | Cambodia | 21.5 /100 | #200 | Fair 6.2% |
| Immigrants | Central America | 20.1 /100 | #201 | Fair 6.2% |
| Albanians | 19.7 /100 | #202 | Poor 6.2% |
| Immigrants | Ukraine | 18.4 /100 | #203 | Poor 6.2% |
| Immigrants | Congo | 18.2 /100 | #204 | Poor 6.2% |
| Slovenes | 18.0 /100 | #205 | Poor 6.2% |