Immigrants from Costa Rica vs Central American Disability
COMPARE
Immigrants from Costa Rica
Central American
Disability
Disability Comparison
Immigrants from Costa Rica
Central Americans
11.4%
DISABILITY
93.4/ 100
METRIC RATING
121st/ 347
METRIC RANK
11.4%
DISABILITY
93.5/ 100
METRIC RATING
119th/ 347
METRIC RANK
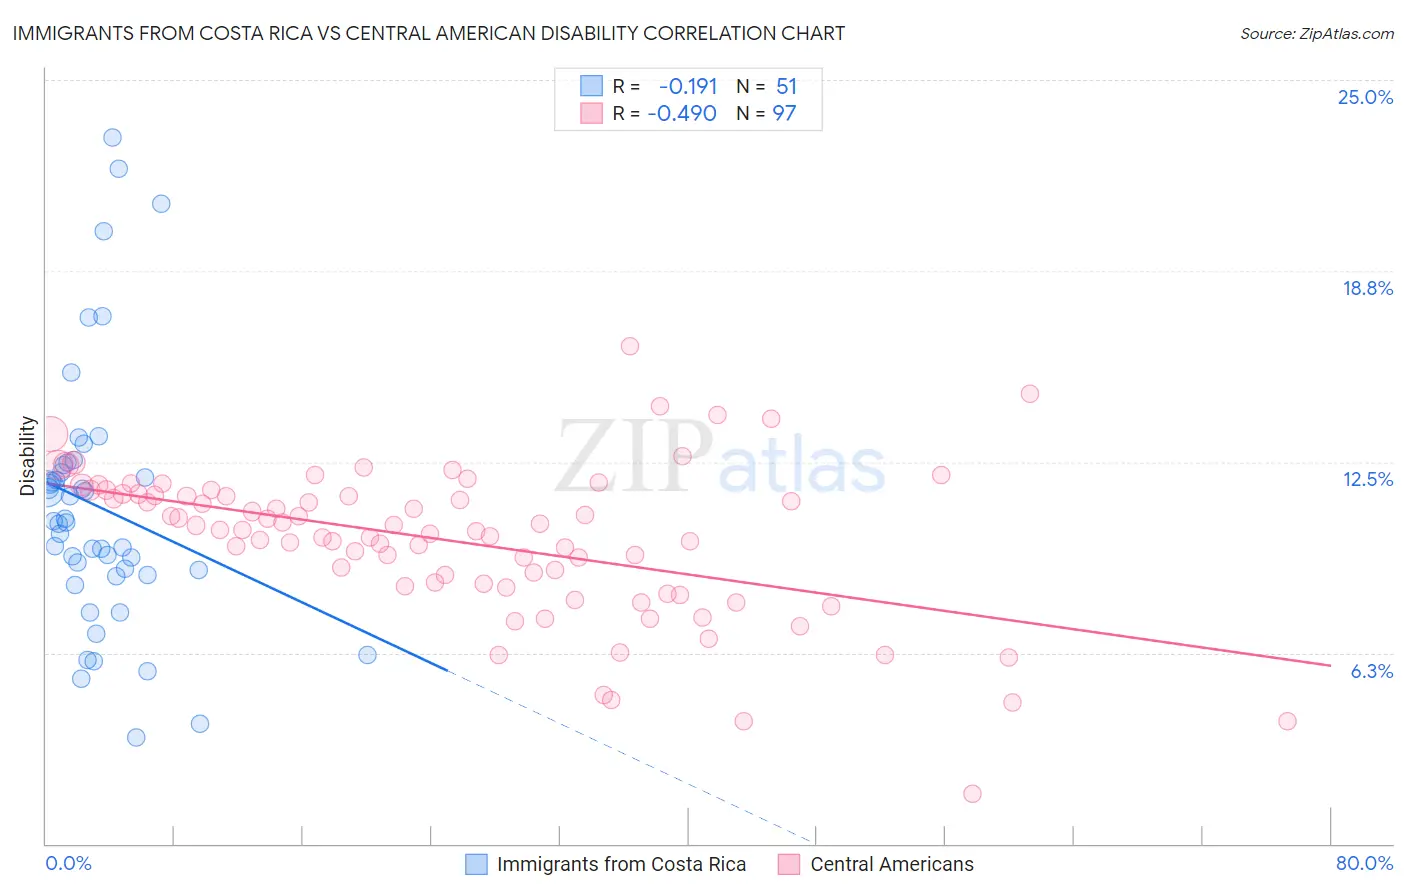
Immigrants from Costa Rica vs Central American Disability Correlation Chart
The statistical analysis conducted on geographies consisting of 204,275,653 people shows a poor negative correlation between the proportion of Immigrants from Costa Rica and percentage of population with a disability in the United States with a correlation coefficient (R) of -0.191 and weighted average of 11.4%. Similarly, the statistical analysis conducted on geographies consisting of 504,498,688 people shows a moderate negative correlation between the proportion of Central Americans and percentage of population with a disability in the United States with a correlation coefficient (R) of -0.490 and weighted average of 11.4%, a difference of 0.010%.
Disability Correlation Summary
| Measurement | Immigrants from Costa Rica | Central American |
| Minimum | 3.5% | 1.6% |
| Maximum | 23.1% | 16.3% |
| Range | 19.6% | 14.6% |
| Mean | 11.0% | 9.9% |
| Median | 10.5% | 10.3% |
| Interquartile 25% (IQ1) | 8.8% | 8.5% |
| Interquartile 75% (IQ3) | 12.4% | 11.4% |
| Interquartile Range (IQR) | 3.6% | 3.0% |
| Standard Deviation (Sample) | 4.2% | 2.5% |
| Standard Deviation (Population) | 4.2% | 2.5% |
Demographics Similar to Immigrants from Costa Rica and Central Americans by Disability
In terms of disability, the demographic groups most similar to Immigrants from Costa Rica are Immigrants from North Macedonia (11.4%, a difference of 0.010%), Brazilian (11.4%, a difference of 0.020%), Korean (11.3%, a difference of 0.070%), Luxembourger (11.3%, a difference of 0.080%), and Immigrants from Northern Europe (11.3%, a difference of 0.13%). Similarly, the demographic groups most similar to Central Americans are Immigrants from North Macedonia (11.4%, a difference of 0.0%), Brazilian (11.4%, a difference of 0.040%), Korean (11.3%, a difference of 0.050%), Luxembourger (11.3%, a difference of 0.070%), and Immigrants from Northern Europe (11.3%, a difference of 0.12%).
| Demographics | Rating | Rank | Disability |
| Immigrants | Denmark | 95.6 /100 | #110 | Exceptional 11.3% |
| Immigrants | South Eastern Asia | 95.4 /100 | #111 | Exceptional 11.3% |
| Immigrants | Uzbekistan | 94.9 /100 | #112 | Exceptional 11.3% |
| Guyanese | 94.7 /100 | #113 | Exceptional 11.3% |
| Immigrants | Syria | 94.7 /100 | #114 | Exceptional 11.3% |
| Immigrants | Philippines | 94.6 /100 | #115 | Exceptional 11.3% |
| Immigrants | Northern Europe | 94.1 /100 | #116 | Exceptional 11.3% |
| Luxembourgers | 93.9 /100 | #117 | Exceptional 11.3% |
| Koreans | 93.8 /100 | #118 | Exceptional 11.3% |
| Central Americans | 93.5 /100 | #119 | Exceptional 11.4% |
| Immigrants | North Macedonia | 93.5 /100 | #120 | Exceptional 11.4% |
| Immigrants | Costa Rica | 93.4 /100 | #121 | Exceptional 11.4% |
| Brazilians | 93.3 /100 | #122 | Exceptional 11.4% |
| South Africans | 92.3 /100 | #123 | Exceptional 11.4% |
| South American Indians | 92.2 /100 | #124 | Exceptional 11.4% |
| Costa Ricans | 91.9 /100 | #125 | Exceptional 11.4% |
| Immigrants | Latvia | 90.9 /100 | #126 | Exceptional 11.4% |
| Immigrants | Italy | 90.4 /100 | #127 | Exceptional 11.4% |
| Immigrants | Europe | 90.4 /100 | #128 | Exceptional 11.4% |
| Macedonians | 90.3 /100 | #129 | Exceptional 11.4% |
| Latvians | 89.8 /100 | #130 | Excellent 11.4% |