Immigrants from Chile vs Central American Disability
COMPARE
Immigrants from Chile
Central American
Disability
Disability Comparison
Immigrants from Chile
Central Americans
11.0%
DISABILITY
99.4/ 100
METRIC RATING
72nd/ 347
METRIC RANK
11.4%
DISABILITY
93.5/ 100
METRIC RATING
119th/ 347
METRIC RANK
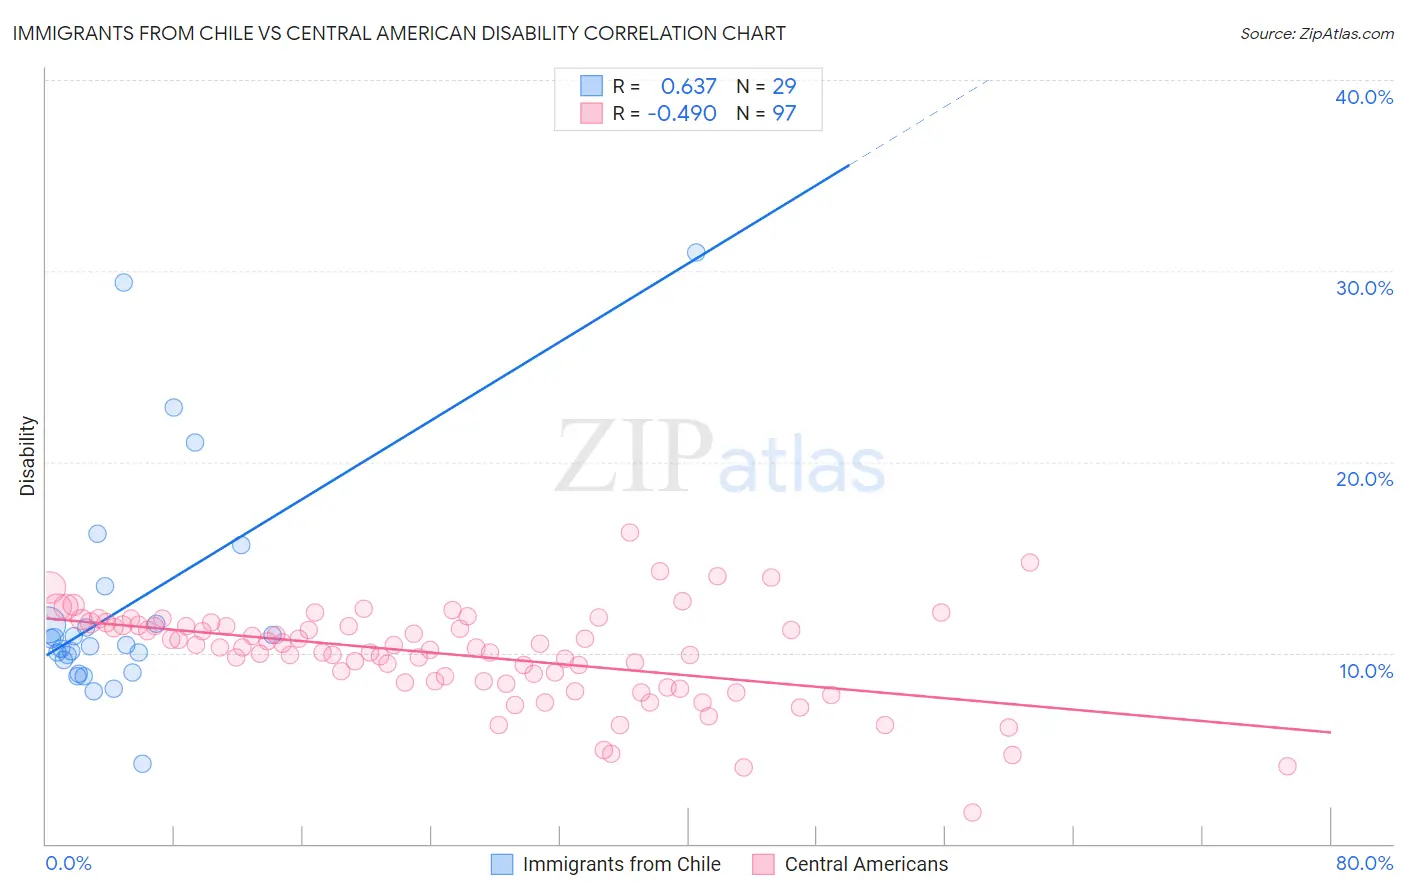
Immigrants from Chile vs Central American Disability Correlation Chart
The statistical analysis conducted on geographies consisting of 218,638,436 people shows a significant positive correlation between the proportion of Immigrants from Chile and percentage of population with a disability in the United States with a correlation coefficient (R) of 0.637 and weighted average of 11.0%. Similarly, the statistical analysis conducted on geographies consisting of 504,498,688 people shows a moderate negative correlation between the proportion of Central Americans and percentage of population with a disability in the United States with a correlation coefficient (R) of -0.490 and weighted average of 11.4%, a difference of 2.9%.
Disability Correlation Summary
| Measurement | Immigrants from Chile | Central American |
| Minimum | 4.2% | 1.6% |
| Maximum | 31.0% | 16.3% |
| Range | 26.8% | 14.6% |
| Mean | 12.5% | 9.9% |
| Median | 10.4% | 10.3% |
| Interquartile 25% (IQ1) | 9.3% | 8.5% |
| Interquartile 75% (IQ3) | 12.5% | 11.4% |
| Interquartile Range (IQR) | 3.2% | 3.0% |
| Standard Deviation (Sample) | 6.1% | 2.5% |
| Standard Deviation (Population) | 6.0% | 2.5% |
Similar Demographics by Disability
Demographics Similar to Immigrants from Chile by Disability
In terms of disability, the demographic groups most similar to Immigrants from Chile are Immigrants from Bangladesh (11.0%, a difference of 0.030%), Immigrants from Serbia (11.0%, a difference of 0.040%), Immigrants from Vietnam (11.0%, a difference of 0.070%), Immigrants from Lebanon (11.0%, a difference of 0.090%), and Sierra Leonean (11.0%, a difference of 0.090%).
| Demographics | Rating | Rank | Disability |
| Bulgarians | 99.6 /100 | #65 | Exceptional 11.0% |
| Laotians | 99.6 /100 | #66 | Exceptional 11.0% |
| Colombians | 99.6 /100 | #67 | Exceptional 11.0% |
| Immigrants | Afghanistan | 99.6 /100 | #68 | Exceptional 11.0% |
| Sri Lankans | 99.5 /100 | #69 | Exceptional 11.0% |
| Immigrants | France | 99.4 /100 | #70 | Exceptional 11.0% |
| Immigrants | Lebanon | 99.4 /100 | #71 | Exceptional 11.0% |
| Immigrants | Chile | 99.4 /100 | #72 | Exceptional 11.0% |
| Immigrants | Bangladesh | 99.4 /100 | #73 | Exceptional 11.0% |
| Immigrants | Serbia | 99.4 /100 | #74 | Exceptional 11.0% |
| Immigrants | Vietnam | 99.4 /100 | #75 | Exceptional 11.0% |
| Sierra Leoneans | 99.3 /100 | #76 | Exceptional 11.0% |
| Immigrants | Belgium | 99.3 /100 | #77 | Exceptional 11.0% |
| Immigrants | Cameroon | 99.3 /100 | #78 | Exceptional 11.1% |
| Immigrants | Jordan | 99.3 /100 | #79 | Exceptional 11.1% |
Demographics Similar to Central Americans by Disability
In terms of disability, the demographic groups most similar to Central Americans are Immigrants from North Macedonia (11.4%, a difference of 0.0%), Immigrants from Costa Rica (11.4%, a difference of 0.010%), Brazilian (11.4%, a difference of 0.040%), Korean (11.3%, a difference of 0.050%), and Luxembourger (11.3%, a difference of 0.070%).
| Demographics | Rating | Rank | Disability |
| Immigrants | Uzbekistan | 94.9 /100 | #112 | Exceptional 11.3% |
| Guyanese | 94.7 /100 | #113 | Exceptional 11.3% |
| Immigrants | Syria | 94.7 /100 | #114 | Exceptional 11.3% |
| Immigrants | Philippines | 94.6 /100 | #115 | Exceptional 11.3% |
| Immigrants | Northern Europe | 94.1 /100 | #116 | Exceptional 11.3% |
| Luxembourgers | 93.9 /100 | #117 | Exceptional 11.3% |
| Koreans | 93.8 /100 | #118 | Exceptional 11.3% |
| Central Americans | 93.5 /100 | #119 | Exceptional 11.4% |
| Immigrants | North Macedonia | 93.5 /100 | #120 | Exceptional 11.4% |
| Immigrants | Costa Rica | 93.4 /100 | #121 | Exceptional 11.4% |
| Brazilians | 93.3 /100 | #122 | Exceptional 11.4% |
| South Africans | 92.3 /100 | #123 | Exceptional 11.4% |
| South American Indians | 92.2 /100 | #124 | Exceptional 11.4% |
| Costa Ricans | 91.9 /100 | #125 | Exceptional 11.4% |
| Immigrants | Latvia | 90.9 /100 | #126 | Exceptional 11.4% |