Immigrants from Mexico vs Central American Female Poverty Among 25-34 Year Olds
COMPARE
Immigrants from Mexico
Central American
Female Poverty Among 25-34 Year Olds
Female Poverty Among 25-34 Year Olds Comparison
Immigrants from Mexico
Central Americans
16.8%
FEMALE POVERTY AMONG 25-34 YEAR OLDS
0.0/ 100
METRIC RATING
303rd/ 347
METRIC RANK
15.5%
FEMALE POVERTY AMONG 25-34 YEAR OLDS
0.1/ 100
METRIC RATING
267th/ 347
METRIC RANK
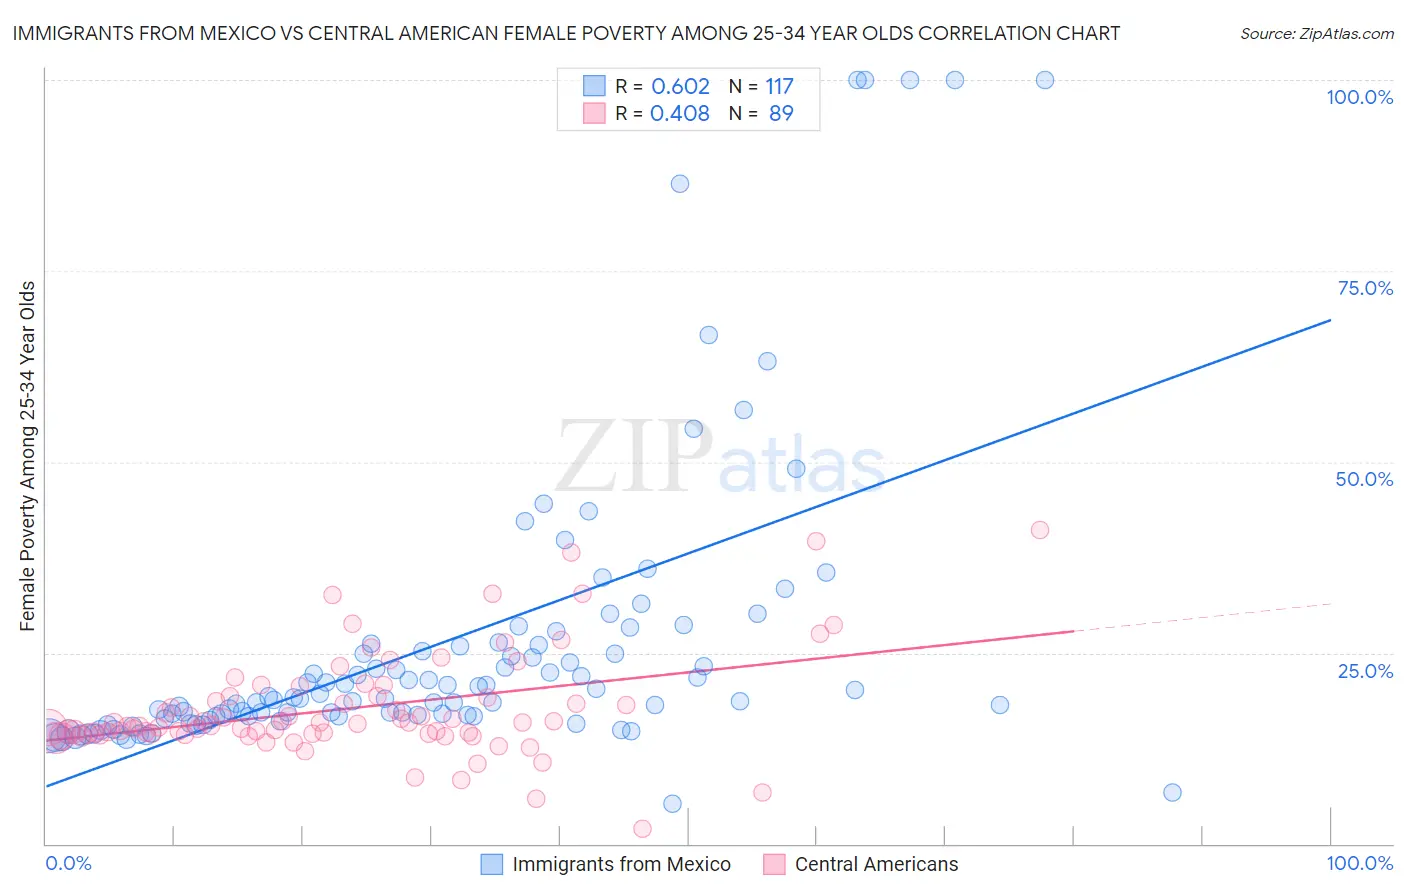
Immigrants from Mexico vs Central American Female Poverty Among 25-34 Year Olds Correlation Chart
The statistical analysis conducted on geographies consisting of 502,193,205 people shows a significant positive correlation between the proportion of Immigrants from Mexico and poverty level among females between the ages 25 and 34 in the United States with a correlation coefficient (R) of 0.602 and weighted average of 16.8%. Similarly, the statistical analysis conducted on geographies consisting of 493,853,689 people shows a moderate positive correlation between the proportion of Central Americans and poverty level among females between the ages 25 and 34 in the United States with a correlation coefficient (R) of 0.408 and weighted average of 15.5%, a difference of 8.6%.
Female Poverty Among 25-34 Year Olds Correlation Summary
| Measurement | Immigrants from Mexico | Central American |
| Minimum | 5.3% | 2.0% |
| Maximum | 100.0% | 41.0% |
| Range | 94.7% | 39.0% |
| Mean | 26.1% | 17.7% |
| Median | 19.0% | 15.8% |
| Interquartile 25% (IQ1) | 16.7% | 14.4% |
| Interquartile 75% (IQ3) | 25.9% | 19.4% |
| Interquartile Range (IQR) | 9.2% | 5.0% |
| Standard Deviation (Sample) | 19.6% | 6.8% |
| Standard Deviation (Population) | 19.5% | 6.8% |
Similar Demographics by Female Poverty Among 25-34 Year Olds
Demographics Similar to Immigrants from Mexico by Female Poverty Among 25-34 Year Olds
In terms of female poverty among 25-34 year olds, the demographic groups most similar to Immigrants from Mexico are Alaska Native (16.8%, a difference of 0.31%), Honduran (16.9%, a difference of 0.42%), Immigrants from Congo (16.7%, a difference of 0.43%), U.S. Virgin Islander (16.7%, a difference of 0.44%), and Spanish American (16.7%, a difference of 0.58%).
| Demographics | Rating | Rank | Female Poverty Among 25-34 Year Olds |
| Hispanics or Latinos | 0.0 /100 | #296 | Tragic 16.6% |
| Immigrants | Guatemala | 0.0 /100 | #297 | Tragic 16.6% |
| Blackfeet | 0.0 /100 | #298 | Tragic 16.7% |
| Spanish Americans | 0.0 /100 | #299 | Tragic 16.7% |
| U.S. Virgin Islanders | 0.0 /100 | #300 | Tragic 16.7% |
| Immigrants | Congo | 0.0 /100 | #301 | Tragic 16.7% |
| Alaska Natives | 0.0 /100 | #302 | Tragic 16.8% |
| Immigrants | Mexico | 0.0 /100 | #303 | Tragic 16.8% |
| Hondurans | 0.0 /100 | #304 | Tragic 16.9% |
| Immigrants | Cabo Verde | 0.0 /100 | #305 | Tragic 16.9% |
| Chickasaw | 0.0 /100 | #306 | Tragic 17.0% |
| Yaqui | 0.0 /100 | #307 | Tragic 17.0% |
| Africans | 0.0 /100 | #308 | Tragic 17.0% |
| Ottawa | 0.0 /100 | #309 | Tragic 17.1% |
| Cherokee | 0.0 /100 | #310 | Tragic 17.2% |
Demographics Similar to Central Americans by Female Poverty Among 25-34 Year Olds
In terms of female poverty among 25-34 year olds, the demographic groups most similar to Central Americans are Immigrants from Somalia (15.4%, a difference of 0.38%), Immigrants from Liberia (15.4%, a difference of 0.39%), Pennsylvania German (15.4%, a difference of 0.42%), Immigrants from Senegal (15.6%, a difference of 0.42%), and Subsaharan African (15.6%, a difference of 0.64%).
| Demographics | Rating | Rank | Female Poverty Among 25-34 Year Olds |
| Marshallese | 0.2 /100 | #260 | Tragic 15.3% |
| Liberians | 0.2 /100 | #261 | Tragic 15.3% |
| Immigrants | Belize | 0.2 /100 | #262 | Tragic 15.3% |
| Mexican American Indians | 0.2 /100 | #263 | Tragic 15.4% |
| Pennsylvania Germans | 0.1 /100 | #264 | Tragic 15.4% |
| Immigrants | Liberia | 0.1 /100 | #265 | Tragic 15.4% |
| Immigrants | Somalia | 0.1 /100 | #266 | Tragic 15.4% |
| Central Americans | 0.1 /100 | #267 | Tragic 15.5% |
| Immigrants | Senegal | 0.1 /100 | #268 | Tragic 15.6% |
| Sub-Saharan Africans | 0.1 /100 | #269 | Tragic 15.6% |
| British West Indians | 0.1 /100 | #270 | Tragic 15.6% |
| Cree | 0.1 /100 | #271 | Tragic 15.6% |
| Senegalese | 0.1 /100 | #272 | Tragic 15.6% |
| Immigrants | Nonimmigrants | 0.1 /100 | #273 | Tragic 15.6% |
| Immigrants | Caribbean | 0.0 /100 | #274 | Tragic 15.7% |