Immigrants from Malaysia vs Yugoslavian Hearing Disability
COMPARE
Immigrants from Malaysia
Yugoslavian
Hearing Disability
Hearing Disability Comparison
Immigrants from Malaysia
Yugoslavians
2.7%
HEARING DISABILITY
97.5/ 100
METRIC RATING
77th/ 347
METRIC RANK
3.3%
HEARING DISABILITY
1.0/ 100
METRIC RATING
242nd/ 347
METRIC RANK
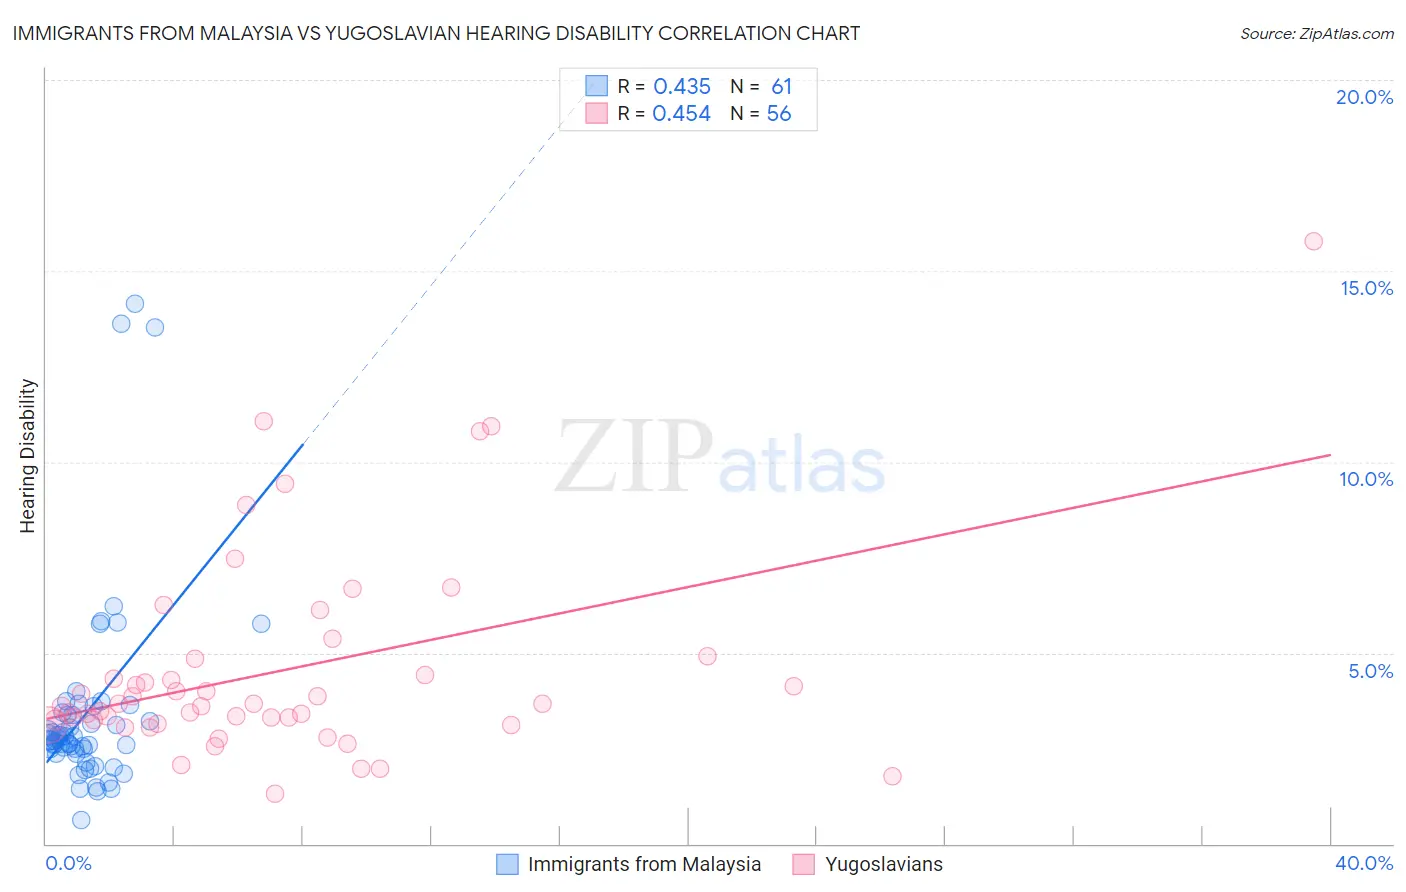
Immigrants from Malaysia vs Yugoslavian Hearing Disability Correlation Chart
The statistical analysis conducted on geographies consisting of 197,956,829 people shows a moderate positive correlation between the proportion of Immigrants from Malaysia and percentage of population with hearing disability in the United States with a correlation coefficient (R) of 0.435 and weighted average of 2.7%. Similarly, the statistical analysis conducted on geographies consisting of 285,663,811 people shows a moderate positive correlation between the proportion of Yugoslavians and percentage of population with hearing disability in the United States with a correlation coefficient (R) of 0.454 and weighted average of 3.3%, a difference of 21.1%.
Hearing Disability Correlation Summary
| Measurement | Immigrants from Malaysia | Yugoslavian |
| Minimum | 0.63% | 1.3% |
| Maximum | 14.1% | 15.8% |
| Range | 13.5% | 14.5% |
| Mean | 3.4% | 4.5% |
| Median | 2.7% | 3.6% |
| Interquartile 25% (IQ1) | 2.4% | 3.2% |
| Interquartile 75% (IQ3) | 3.4% | 4.6% |
| Interquartile Range (IQR) | 0.98% | 1.5% |
| Standard Deviation (Sample) | 2.6% | 2.7% |
| Standard Deviation (Population) | 2.6% | 2.7% |
Similar Demographics by Hearing Disability
Demographics Similar to Immigrants from Malaysia by Hearing Disability
In terms of hearing disability, the demographic groups most similar to Immigrants from Malaysia are Asian (2.7%, a difference of 0.020%), Immigrants from Saudi Arabia (2.7%, a difference of 0.030%), Mongolian (2.7%, a difference of 0.040%), Immigrants from Korea (2.7%, a difference of 0.050%), and Argentinean (2.7%, a difference of 0.060%).
| Demographics | Rating | Rank | Hearing Disability |
| Peruvians | 97.7 /100 | #70 | Exceptional 2.7% |
| Central Americans | 97.7 /100 | #71 | Exceptional 2.7% |
| Afghans | 97.6 /100 | #72 | Exceptional 2.7% |
| Argentineans | 97.5 /100 | #73 | Exceptional 2.7% |
| Immigrants | Korea | 97.5 /100 | #74 | Exceptional 2.7% |
| Immigrants | Saudi Arabia | 97.5 /100 | #75 | Exceptional 2.7% |
| Asians | 97.5 /100 | #76 | Exceptional 2.7% |
| Immigrants | Malaysia | 97.5 /100 | #77 | Exceptional 2.7% |
| Mongolians | 97.4 /100 | #78 | Exceptional 2.7% |
| Colombians | 97.4 /100 | #79 | Exceptional 2.7% |
| Immigrants | Asia | 97.2 /100 | #80 | Exceptional 2.7% |
| Immigrants | Uruguay | 97.2 /100 | #81 | Exceptional 2.7% |
| Immigrants | Armenia | 97.2 /100 | #82 | Exceptional 2.7% |
| Immigrants | Cuba | 97.2 /100 | #83 | Exceptional 2.7% |
| Immigrants | Argentina | 97.0 /100 | #84 | Exceptional 2.8% |
Demographics Similar to Yugoslavians by Hearing Disability
In terms of hearing disability, the demographic groups most similar to Yugoslavians are Samoan (3.3%, a difference of 0.11%), Immigrants from Western Europe (3.3%, a difference of 0.17%), Immigrants from Netherlands (3.3%, a difference of 0.18%), Assyrian/Chaldean/Syriac (3.3%, a difference of 0.24%), and Nepalese (3.3%, a difference of 0.36%).
| Demographics | Rating | Rank | Hearing Disability |
| Guamanians/Chamorros | 2.2 /100 | #235 | Tragic 3.3% |
| Serbians | 2.2 /100 | #236 | Tragic 3.3% |
| Immigrants | Austria | 1.8 /100 | #237 | Tragic 3.3% |
| German Russians | 1.8 /100 | #238 | Tragic 3.3% |
| Nepalese | 1.2 /100 | #239 | Tragic 3.3% |
| Immigrants | Netherlands | 1.1 /100 | #240 | Tragic 3.3% |
| Samoans | 1.1 /100 | #241 | Tragic 3.3% |
| Yugoslavians | 1.0 /100 | #242 | Tragic 3.3% |
| Immigrants | Western Europe | 1.0 /100 | #243 | Tragic 3.3% |
| Assyrians/Chaldeans/Syriacs | 0.9 /100 | #244 | Tragic 3.3% |
| Immigrants | Scotland | 0.8 /100 | #245 | Tragic 3.3% |
| Immigrants | England | 0.7 /100 | #246 | Tragic 3.3% |
| Lithuanians | 0.6 /100 | #247 | Tragic 3.4% |
| Austrians | 0.6 /100 | #248 | Tragic 3.4% |
| Italians | 0.4 /100 | #249 | Tragic 3.4% |