Immigrants from Malaysia vs Bermudan Unemployment Among Ages 30 to 34 years
COMPARE
Immigrants from Malaysia
Bermudan
Unemployment Among Ages 30 to 34 years
Unemployment Among Ages 30 to 34 years Comparison
Immigrants from Malaysia
Bermudans
5.1%
UNEMPLOYMENT AMONG AGES 30 TO 34 YEARS
98.3/ 100
METRIC RATING
49th/ 347
METRIC RANK
5.8%
UNEMPLOYMENT AMONG AGES 30 TO 34 YEARS
2.7/ 100
METRIC RATING
223rd/ 347
METRIC RANK
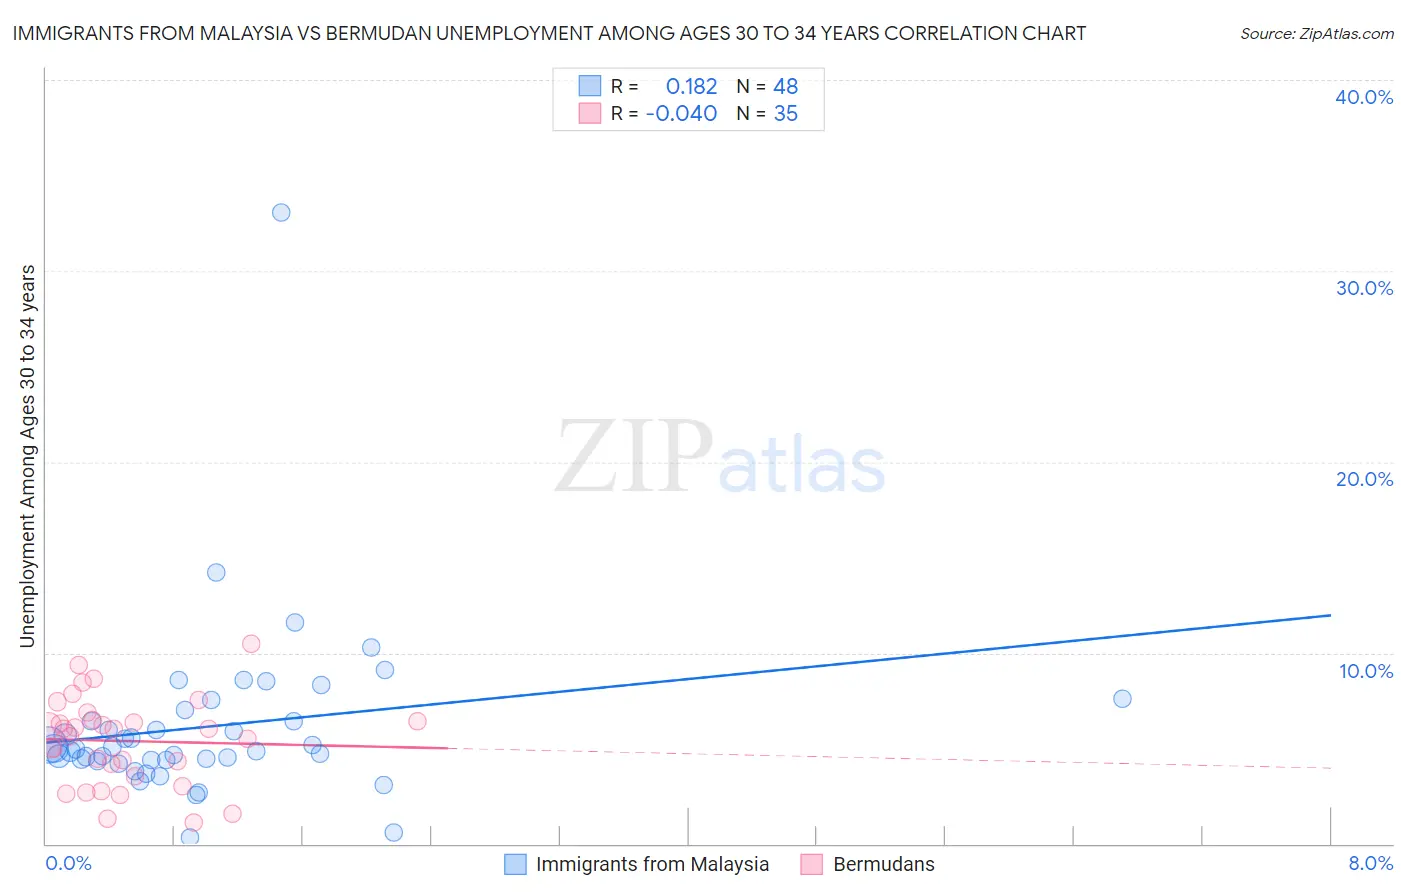
Immigrants from Malaysia vs Bermudan Unemployment Among Ages 30 to 34 years Correlation Chart
The statistical analysis conducted on geographies consisting of 192,967,482 people shows a poor positive correlation between the proportion of Immigrants from Malaysia and unemployment rate among population between the ages 30 and 34 in the United States with a correlation coefficient (R) of 0.182 and weighted average of 5.1%. Similarly, the statistical analysis conducted on geographies consisting of 55,169,174 people shows no correlation between the proportion of Bermudans and unemployment rate among population between the ages 30 and 34 in the United States with a correlation coefficient (R) of -0.040 and weighted average of 5.8%, a difference of 14.2%.
Unemployment Among Ages 30 to 34 years Correlation Summary
| Measurement | Immigrants from Malaysia | Bermudan |
| Minimum | 0.30% | 1.1% |
| Maximum | 33.1% | 10.5% |
| Range | 32.8% | 9.4% |
| Mean | 6.1% | 5.4% |
| Median | 5.0% | 6.0% |
| Interquartile 25% (IQ1) | 4.4% | 3.5% |
| Interquartile 75% (IQ3) | 6.7% | 6.5% |
| Interquartile Range (IQR) | 2.3% | 3.0% |
| Standard Deviation (Sample) | 4.7% | 2.3% |
| Standard Deviation (Population) | 4.7% | 2.3% |
Similar Demographics by Unemployment Among Ages 30 to 34 years
Demographics Similar to Immigrants from Malaysia by Unemployment Among Ages 30 to 34 years
In terms of unemployment among ages 30 to 34 years, the demographic groups most similar to Immigrants from Malaysia are Puget Sound Salish (5.1%, a difference of 0.080%), Turkish (5.1%, a difference of 0.11%), Assyrian/Chaldean/Syriac (5.1%, a difference of 0.12%), Cypriot (5.1%, a difference of 0.14%), and Immigrants from Burma/Myanmar (5.1%, a difference of 0.14%).
| Demographics | Rating | Rank | Unemployment Among Ages 30 to 34 years |
| Immigrants | Hong Kong | 98.8 /100 | #42 | Exceptional 5.0% |
| Soviet Union | 98.8 /100 | #43 | Exceptional 5.0% |
| Immigrants | Belgium | 98.7 /100 | #44 | Exceptional 5.1% |
| Yugoslavians | 98.6 /100 | #45 | Exceptional 5.1% |
| Immigrants | Congo | 98.4 /100 | #46 | Exceptional 5.1% |
| Cypriots | 98.4 /100 | #47 | Exceptional 5.1% |
| Assyrians/Chaldeans/Syriacs | 98.4 /100 | #48 | Exceptional 5.1% |
| Immigrants | Malaysia | 98.3 /100 | #49 | Exceptional 5.1% |
| Puget Sound Salish | 98.2 /100 | #50 | Exceptional 5.1% |
| Turks | 98.2 /100 | #51 | Exceptional 5.1% |
| Immigrants | Burma/Myanmar | 98.1 /100 | #52 | Exceptional 5.1% |
| Cubans | 98.1 /100 | #53 | Exceptional 5.1% |
| Immigrants | Morocco | 97.9 /100 | #54 | Exceptional 5.1% |
| Chinese | 97.7 /100 | #55 | Exceptional 5.1% |
| Immigrants | Serbia | 97.4 /100 | #56 | Exceptional 5.1% |
Demographics Similar to Bermudans by Unemployment Among Ages 30 to 34 years
In terms of unemployment among ages 30 to 34 years, the demographic groups most similar to Bermudans are Slovak (5.8%, a difference of 0.15%), Samoan (5.8%, a difference of 0.17%), Spaniard (5.8%, a difference of 0.26%), Liberian (5.8%, a difference of 0.30%), and Guamanian/Chamorro (5.8%, a difference of 0.59%).
| Demographics | Rating | Rank | Unemployment Among Ages 30 to 34 years |
| Immigrants | Syria | 5.5 /100 | #216 | Tragic 5.7% |
| Immigrants | Fiji | 5.1 /100 | #217 | Tragic 5.7% |
| Panamanians | 4.5 /100 | #218 | Tragic 5.8% |
| French Canadians | 4.4 /100 | #219 | Tragic 5.8% |
| Sierra Leoneans | 3.9 /100 | #220 | Tragic 5.8% |
| Guamanians/Chamorros | 3.9 /100 | #221 | Tragic 5.8% |
| Spaniards | 3.2 /100 | #222 | Tragic 5.8% |
| Bermudans | 2.7 /100 | #223 | Tragic 5.8% |
| Slovaks | 2.5 /100 | #224 | Tragic 5.8% |
| Samoans | 2.5 /100 | #225 | Tragic 5.8% |
| Liberians | 2.3 /100 | #226 | Tragic 5.8% |
| Spanish | 1.8 /100 | #227 | Tragic 5.8% |
| Immigrants | Bahamas | 1.8 /100 | #228 | Tragic 5.8% |
| Immigrants | Uzbekistan | 1.5 /100 | #229 | Tragic 5.9% |
| Hawaiians | 1.2 /100 | #230 | Tragic 5.9% |