Immigrants from Malaysia vs Immigrants from Nepal Hearing Disability
COMPARE
Immigrants from Malaysia
Immigrants from Nepal
Hearing Disability
Hearing Disability Comparison
Immigrants from Malaysia
Immigrants from Nepal
2.7%
HEARING DISABILITY
97.5/ 100
METRIC RATING
77th/ 347
METRIC RANK
2.7%
HEARING DISABILITY
98.3/ 100
METRIC RATING
65th/ 347
METRIC RANK
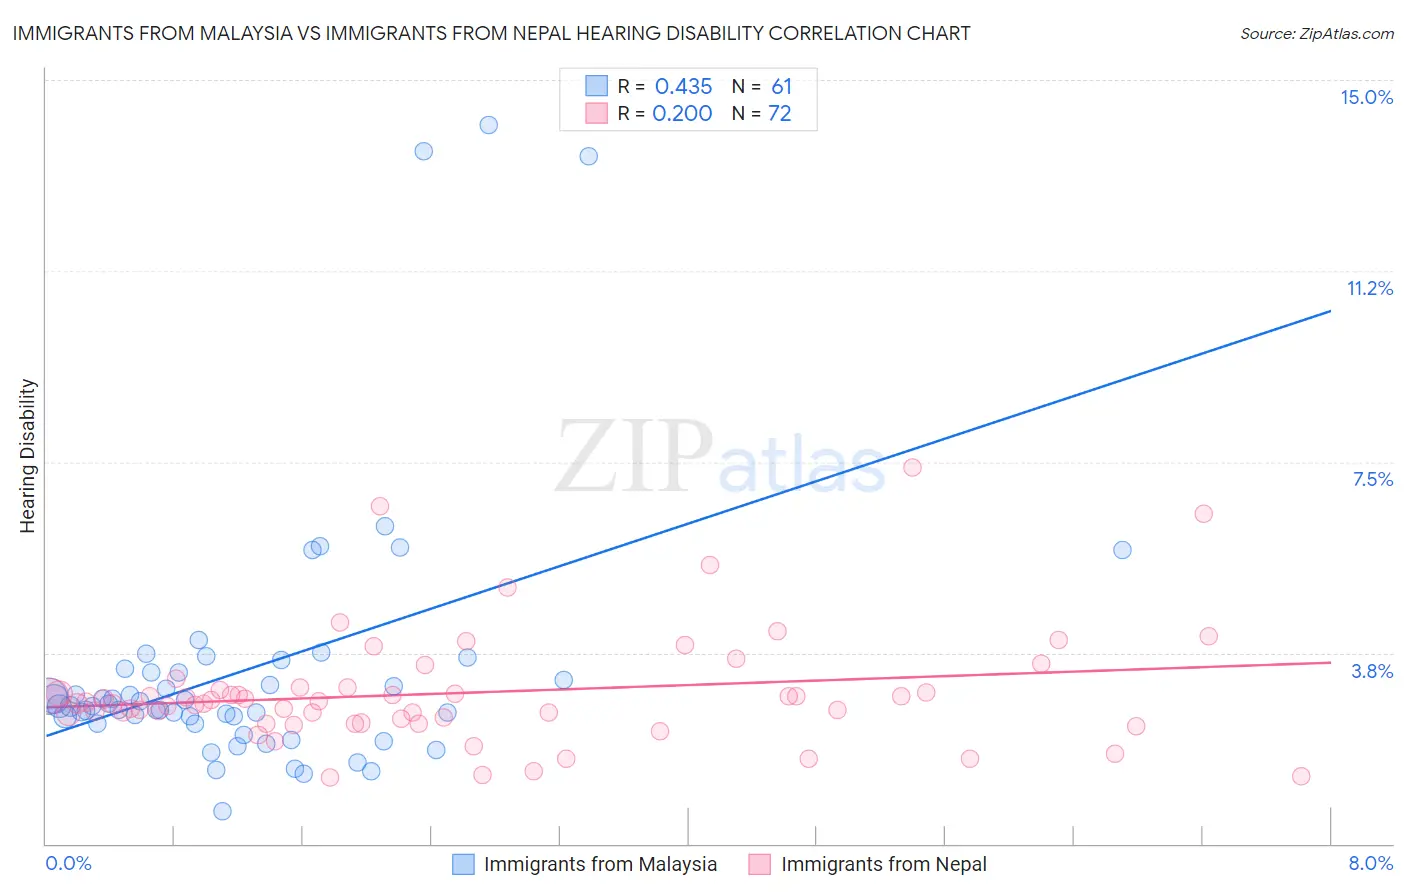
Immigrants from Malaysia vs Immigrants from Nepal Hearing Disability Correlation Chart
The statistical analysis conducted on geographies consisting of 197,956,829 people shows a moderate positive correlation between the proportion of Immigrants from Malaysia and percentage of population with hearing disability in the United States with a correlation coefficient (R) of 0.435 and weighted average of 2.7%. Similarly, the statistical analysis conducted on geographies consisting of 186,754,465 people shows a weak positive correlation between the proportion of Immigrants from Nepal and percentage of population with hearing disability in the United States with a correlation coefficient (R) of 0.200 and weighted average of 2.7%, a difference of 1.0%.
Hearing Disability Correlation Summary
| Measurement | Immigrants from Malaysia | Immigrants from Nepal |
| Minimum | 0.63% | 1.3% |
| Maximum | 14.1% | 7.4% |
| Range | 13.5% | 6.1% |
| Mean | 3.4% | 3.0% |
| Median | 2.7% | 2.8% |
| Interquartile 25% (IQ1) | 2.4% | 2.4% |
| Interquartile 75% (IQ3) | 3.4% | 3.0% |
| Interquartile Range (IQR) | 0.98% | 0.63% |
| Standard Deviation (Sample) | 2.6% | 1.1% |
| Standard Deviation (Population) | 2.6% | 1.1% |
Demographics Similar to Immigrants from Malaysia and Immigrants from Nepal by Hearing Disability
In terms of hearing disability, the demographic groups most similar to Immigrants from Malaysia are Asian (2.7%, a difference of 0.020%), Immigrants from Saudi Arabia (2.7%, a difference of 0.030%), Mongolian (2.7%, a difference of 0.040%), Immigrants from Korea (2.7%, a difference of 0.050%), and Argentinean (2.7%, a difference of 0.060%). Similarly, the demographic groups most similar to Immigrants from Nepal are Immigrants from Sri Lanka (2.7%, a difference of 0.080%), Immigrants from Belize (2.7%, a difference of 0.12%), Indian (Asian) (2.7%, a difference of 0.14%), Immigrants from Uzbekistan (2.7%, a difference of 0.19%), and Immigrants from Colombia (2.7%, a difference of 0.19%).
| Demographics | Rating | Rank | Hearing Disability |
| Immigrants | Uzbekistan | 98.4 /100 | #61 | Exceptional 2.7% |
| Immigrants | Colombia | 98.4 /100 | #62 | Exceptional 2.7% |
| Indians (Asian) | 98.4 /100 | #63 | Exceptional 2.7% |
| Immigrants | Sri Lanka | 98.4 /100 | #64 | Exceptional 2.7% |
| Immigrants | Nepal | 98.3 /100 | #65 | Exceptional 2.7% |
| Immigrants | Belize | 98.2 /100 | #66 | Exceptional 2.7% |
| Egyptians | 98.1 /100 | #67 | Exceptional 2.7% |
| Immigrants | Africa | 98.0 /100 | #68 | Exceptional 2.7% |
| Nicaraguans | 97.9 /100 | #69 | Exceptional 2.7% |
| Peruvians | 97.7 /100 | #70 | Exceptional 2.7% |
| Central Americans | 97.7 /100 | #71 | Exceptional 2.7% |
| Afghans | 97.6 /100 | #72 | Exceptional 2.7% |
| Argentineans | 97.5 /100 | #73 | Exceptional 2.7% |
| Immigrants | Korea | 97.5 /100 | #74 | Exceptional 2.7% |
| Immigrants | Saudi Arabia | 97.5 /100 | #75 | Exceptional 2.7% |
| Asians | 97.5 /100 | #76 | Exceptional 2.7% |
| Immigrants | Malaysia | 97.5 /100 | #77 | Exceptional 2.7% |
| Mongolians | 97.4 /100 | #78 | Exceptional 2.7% |
| Colombians | 97.4 /100 | #79 | Exceptional 2.7% |
| Immigrants | Asia | 97.2 /100 | #80 | Exceptional 2.7% |
| Immigrants | Uruguay | 97.2 /100 | #81 | Exceptional 2.7% |