Immigrants from Latin America vs Menominee Unemployment Among Ages 30 to 34 years
COMPARE
Immigrants from Latin America
Menominee
Unemployment Among Ages 30 to 34 years
Unemployment Among Ages 30 to 34 years Comparison
Immigrants from Latin America
Menominee
6.1%
UNEMPLOYMENT AMONG AGES 30 TO 34 YEARS
0.1/ 100
METRIC RATING
260th/ 347
METRIC RANK
6.4%
UNEMPLOYMENT AMONG AGES 30 TO 34 YEARS
0.0/ 100
METRIC RATING
289th/ 347
METRIC RANK
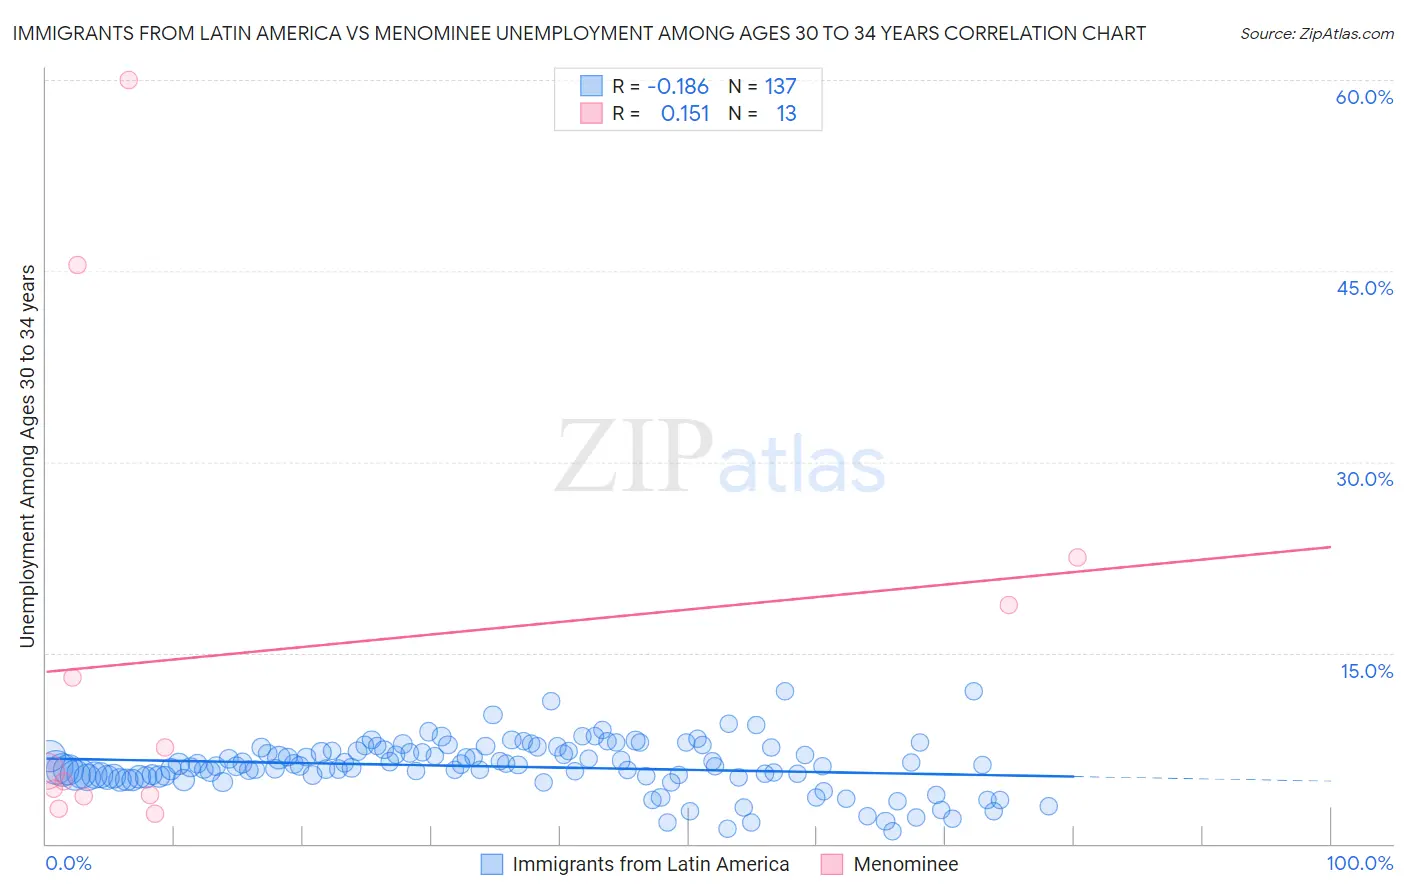
Immigrants from Latin America vs Menominee Unemployment Among Ages 30 to 34 years Correlation Chart
The statistical analysis conducted on geographies consisting of 495,403,747 people shows a poor negative correlation between the proportion of Immigrants from Latin America and unemployment rate among population between the ages 30 and 34 in the United States with a correlation coefficient (R) of -0.186 and weighted average of 6.1%. Similarly, the statistical analysis conducted on geographies consisting of 44,912,548 people shows a poor positive correlation between the proportion of Menominee and unemployment rate among population between the ages 30 and 34 in the United States with a correlation coefficient (R) of 0.151 and weighted average of 6.4%, a difference of 4.7%.
Unemployment Among Ages 30 to 34 years Correlation Summary
| Measurement | Immigrants from Latin America | Menominee |
| Minimum | 1.0% | 2.4% |
| Maximum | 12.0% | 60.0% |
| Range | 11.0% | 57.6% |
| Mean | 6.1% | 15.0% |
| Median | 6.1% | 5.7% |
| Interquartile 25% (IQ1) | 5.3% | 3.7% |
| Interquartile 75% (IQ3) | 7.3% | 20.6% |
| Interquartile Range (IQR) | 2.0% | 16.9% |
| Standard Deviation (Sample) | 2.0% | 18.1% |
| Standard Deviation (Population) | 2.0% | 17.4% |
Similar Demographics by Unemployment Among Ages 30 to 34 years
Demographics Similar to Immigrants from Latin America by Unemployment Among Ages 30 to 34 years
In terms of unemployment among ages 30 to 34 years, the demographic groups most similar to Immigrants from Latin America are Immigrants from Western Africa (6.2%, a difference of 0.15%), Haitian (6.1%, a difference of 0.22%), Mexican (6.1%, a difference of 0.30%), Immigrants from Central America (6.2%, a difference of 0.33%), and Immigrants from Sierra Leone (6.1%, a difference of 0.36%).
| Demographics | Rating | Rank | Unemployment Among Ages 30 to 34 years |
| Immigrants | Nonimmigrants | 0.2 /100 | #253 | Tragic 6.1% |
| Armenians | 0.1 /100 | #254 | Tragic 6.1% |
| Immigrants | Portugal | 0.1 /100 | #255 | Tragic 6.1% |
| Immigrants | Ghana | 0.1 /100 | #256 | Tragic 6.1% |
| Immigrants | Sierra Leone | 0.1 /100 | #257 | Tragic 6.1% |
| Mexicans | 0.1 /100 | #258 | Tragic 6.1% |
| Haitians | 0.1 /100 | #259 | Tragic 6.1% |
| Immigrants | Latin America | 0.1 /100 | #260 | Tragic 6.1% |
| Immigrants | Western Africa | 0.1 /100 | #261 | Tragic 6.2% |
| Immigrants | Central America | 0.1 /100 | #262 | Tragic 6.2% |
| Spanish Americans | 0.0 /100 | #263 | Tragic 6.2% |
| Chickasaw | 0.0 /100 | #264 | Tragic 6.2% |
| Americans | 0.0 /100 | #265 | Tragic 6.2% |
| Seminole | 0.0 /100 | #266 | Tragic 6.2% |
| Immigrants | Mexico | 0.0 /100 | #267 | Tragic 6.2% |
Demographics Similar to Menominee by Unemployment Among Ages 30 to 34 years
In terms of unemployment among ages 30 to 34 years, the demographic groups most similar to Menominee are Senegalese (6.4%, a difference of 0.040%), Immigrants from West Indies (6.4%, a difference of 0.080%), Central American Indian (6.4%, a difference of 0.10%), Choctaw (6.4%, a difference of 0.14%), and Immigrants from Bangladesh (6.4%, a difference of 0.25%).
| Demographics | Rating | Rank | Unemployment Among Ages 30 to 34 years |
| Africans | 0.0 /100 | #282 | Tragic 6.4% |
| Hispanics or Latinos | 0.0 /100 | #283 | Tragic 6.4% |
| Immigrants | Bangladesh | 0.0 /100 | #284 | Tragic 6.4% |
| Choctaw | 0.0 /100 | #285 | Tragic 6.4% |
| Central American Indians | 0.0 /100 | #286 | Tragic 6.4% |
| Immigrants | West Indies | 0.0 /100 | #287 | Tragic 6.4% |
| Senegalese | 0.0 /100 | #288 | Tragic 6.4% |
| Menominee | 0.0 /100 | #289 | Tragic 6.4% |
| Immigrants | Trinidad and Tobago | 0.0 /100 | #290 | Tragic 6.5% |
| Jamaicans | 0.0 /100 | #291 | Tragic 6.5% |
| Vietnamese | 0.0 /100 | #292 | Tragic 6.5% |
| West Indians | 0.0 /100 | #293 | Tragic 6.5% |
| Barbadians | 0.0 /100 | #294 | Tragic 6.5% |
| Trinidadians and Tobagonians | 0.0 /100 | #295 | Tragic 6.5% |
| Immigrants | Jamaica | 0.0 /100 | #296 | Tragic 6.5% |