Immigrants from Latin America vs Mexican Hearing Disability
COMPARE
Immigrants from Latin America
Mexican
Hearing Disability
Hearing Disability Comparison
Immigrants from Latin America
Mexicans
2.8%
HEARING DISABILITY
90.5/ 100
METRIC RATING
115th/ 347
METRIC RANK
3.2%
HEARING DISABILITY
5.6/ 100
METRIC RATING
223rd/ 347
METRIC RANK
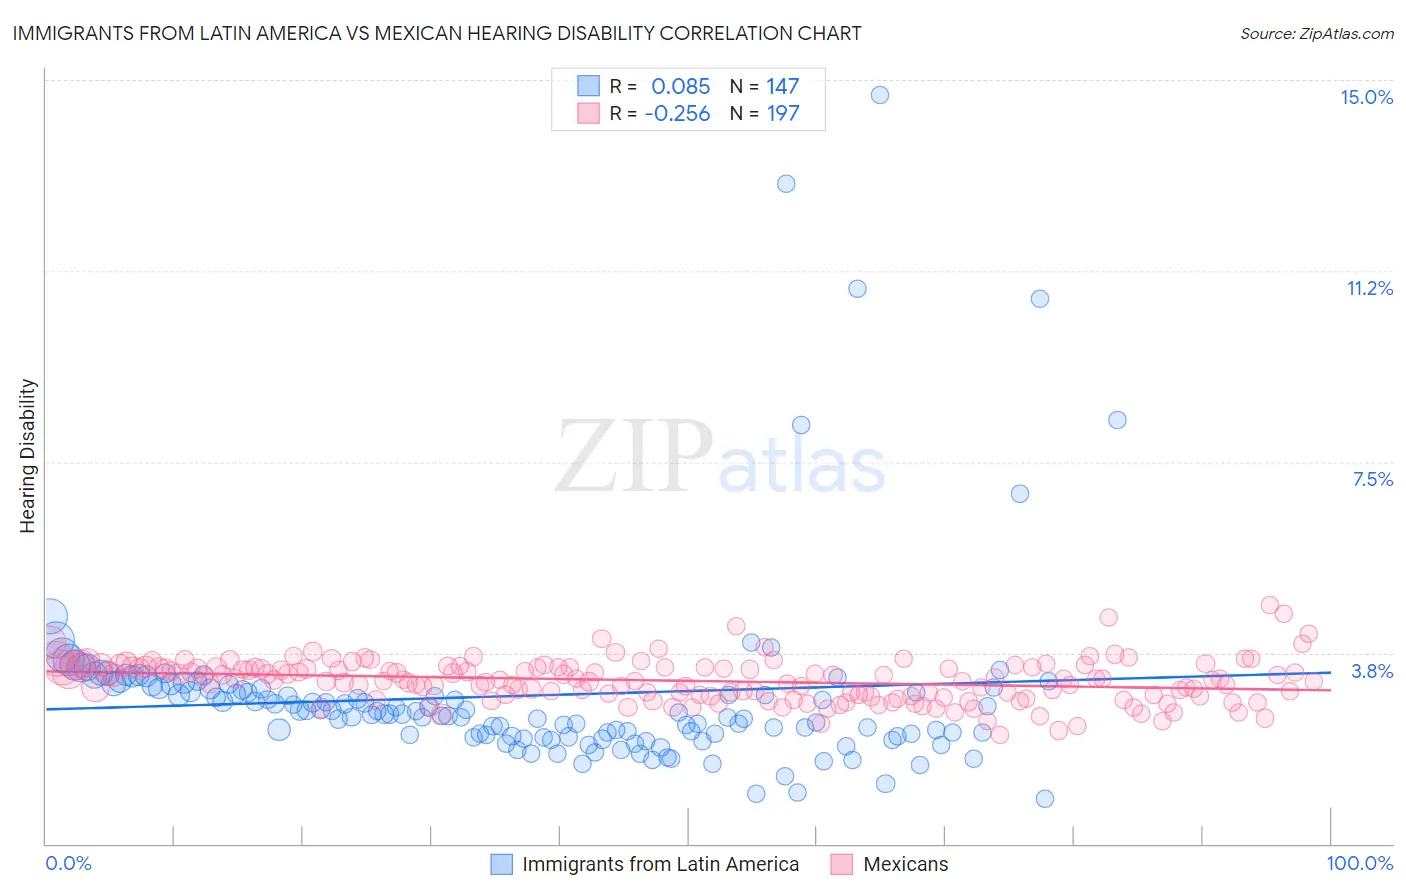
Immigrants from Latin America vs Mexican Hearing Disability Correlation Chart
The statistical analysis conducted on geographies consisting of 557,946,511 people shows a slight positive correlation between the proportion of Immigrants from Latin America and percentage of population with hearing disability in the United States with a correlation coefficient (R) of 0.085 and weighted average of 2.8%. Similarly, the statistical analysis conducted on geographies consisting of 564,483,125 people shows a weak negative correlation between the proportion of Mexicans and percentage of population with hearing disability in the United States with a correlation coefficient (R) of -0.256 and weighted average of 3.2%, a difference of 12.6%.
Hearing Disability Correlation Summary
| Measurement | Immigrants from Latin America | Mexican |
| Minimum | 0.89% | 2.1% |
| Maximum | 14.7% | 4.7% |
| Range | 13.8% | 2.5% |
| Mean | 2.9% | 3.2% |
| Median | 2.6% | 3.2% |
| Interquartile 25% (IQ1) | 2.1% | 2.9% |
| Interquartile 75% (IQ3) | 3.0% | 3.5% |
| Interquartile Range (IQR) | 0.94% | 0.56% |
| Standard Deviation (Sample) | 1.9% | 0.41% |
| Standard Deviation (Population) | 1.9% | 0.41% |
Similar Demographics by Hearing Disability
Demographics Similar to Immigrants from Latin America by Hearing Disability
In terms of hearing disability, the demographic groups most similar to Immigrants from Latin America are Immigrants (2.8%, a difference of 0.060%), Immigrants from Liberia (2.8%, a difference of 0.15%), Zimbabwean (2.8%, a difference of 0.16%), Cambodian (2.8%, a difference of 0.17%), and Kenyan (2.8%, a difference of 0.18%).
| Demographics | Rating | Rank | Hearing Disability |
| Guatemalans | 93.2 /100 | #108 | Exceptional 2.8% |
| Turks | 93.0 /100 | #109 | Exceptional 2.8% |
| Cypriots | 92.9 /100 | #110 | Exceptional 2.8% |
| Immigrants | Yemen | 92.7 /100 | #111 | Exceptional 2.8% |
| U.S. Virgin Islanders | 92.5 /100 | #112 | Exceptional 2.8% |
| Immigrants | Belarus | 91.6 /100 | #113 | Exceptional 2.8% |
| Cambodians | 91.1 /100 | #114 | Exceptional 2.8% |
| Immigrants | Latin America | 90.5 /100 | #115 | Exceptional 2.8% |
| Immigrants | Immigrants | 90.3 /100 | #116 | Exceptional 2.8% |
| Immigrants | Liberia | 90.0 /100 | #117 | Excellent 2.8% |
| Zimbabweans | 89.9 /100 | #118 | Excellent 2.8% |
| Kenyans | 89.8 /100 | #119 | Excellent 2.8% |
| Jordanians | 89.5 /100 | #120 | Excellent 2.8% |
| Cubans | 89.4 /100 | #121 | Excellent 2.8% |
| Liberians | 89.0 /100 | #122 | Excellent 2.8% |
Demographics Similar to Mexicans by Hearing Disability
In terms of hearing disability, the demographic groups most similar to Mexicans are Icelander (3.2%, a difference of 0.17%), Latvian (3.2%, a difference of 0.21%), Lebanese (3.2%, a difference of 0.25%), Immigrants from Oceania (3.2%, a difference of 0.36%), and Immigrants from Laos (3.2%, a difference of 0.40%).
| Demographics | Rating | Rank | Hearing Disability |
| Immigrants | Norway | 7.3 /100 | #216 | Tragic 3.2% |
| Russians | 7.1 /100 | #217 | Tragic 3.2% |
| Immigrants | Northern Europe | 7.0 /100 | #218 | Tragic 3.2% |
| New Zealanders | 6.8 /100 | #219 | Tragic 3.2% |
| Malaysians | 6.6 /100 | #220 | Tragic 3.2% |
| Immigrants | Laos | 6.6 /100 | #221 | Tragic 3.2% |
| Immigrants | Oceania | 6.5 /100 | #222 | Tragic 3.2% |
| Mexicans | 5.6 /100 | #223 | Tragic 3.2% |
| Icelanders | 5.2 /100 | #224 | Tragic 3.2% |
| Latvians | 5.1 /100 | #225 | Tragic 3.2% |
| Lebanese | 5.0 /100 | #226 | Tragic 3.2% |
| Bhutanese | 4.6 /100 | #227 | Tragic 3.2% |
| Immigrants | Portugal | 4.3 /100 | #228 | Tragic 3.2% |
| Maltese | 4.1 /100 | #229 | Tragic 3.2% |
| Greeks | 3.2 /100 | #230 | Tragic 3.2% |