Immigrants from Latin America vs Native/Alaskan Ambulatory Disability
COMPARE
Immigrants from Latin America
Native/Alaskan
Ambulatory Disability
Ambulatory Disability Comparison
Immigrants from Latin America
Natives/Alaskans
6.3%
AMBULATORY DISABILITY
11.0/ 100
METRIC RATING
215th/ 347
METRIC RANK
7.5%
AMBULATORY DISABILITY
0.0/ 100
METRIC RATING
327th/ 347
METRIC RANK
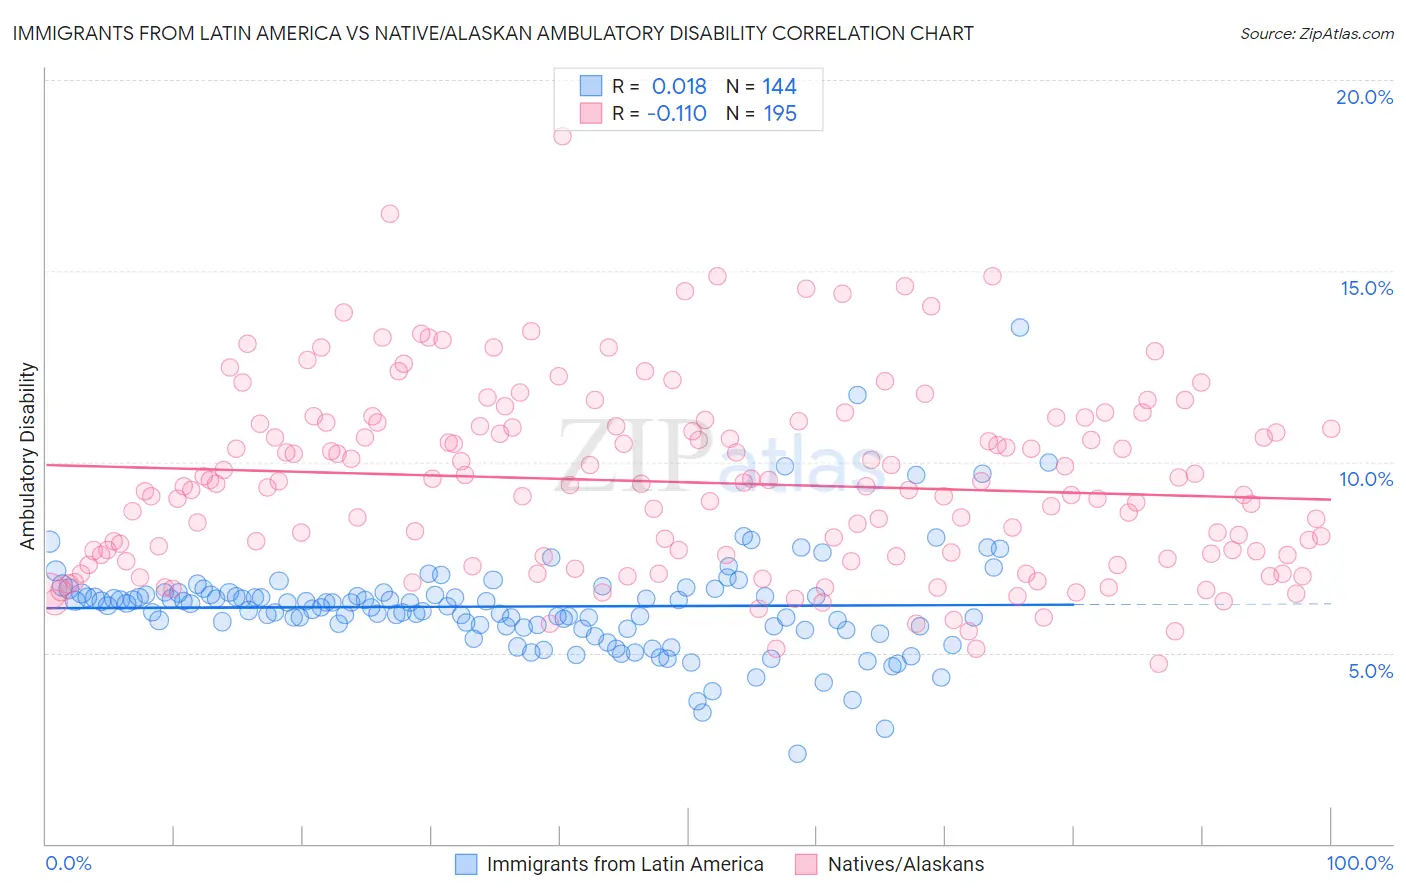
Immigrants from Latin America vs Native/Alaskan Ambulatory Disability Correlation Chart
The statistical analysis conducted on geographies consisting of 558,117,601 people shows no correlation between the proportion of Immigrants from Latin America and percentage of population with ambulatory disability in the United States with a correlation coefficient (R) of 0.018 and weighted average of 6.3%. Similarly, the statistical analysis conducted on geographies consisting of 512,715,386 people shows a poor negative correlation between the proportion of Natives/Alaskans and percentage of population with ambulatory disability in the United States with a correlation coefficient (R) of -0.110 and weighted average of 7.5%, a difference of 19.6%.
Ambulatory Disability Correlation Summary
| Measurement | Immigrants from Latin America | Native/Alaskan |
| Minimum | 2.4% | 4.7% |
| Maximum | 13.5% | 18.5% |
| Range | 11.1% | 13.8% |
| Mean | 6.2% | 9.5% |
| Median | 6.2% | 9.4% |
| Interquartile 25% (IQ1) | 5.7% | 7.5% |
| Interquartile 75% (IQ3) | 6.5% | 11.0% |
| Interquartile Range (IQR) | 0.86% | 3.5% |
| Standard Deviation (Sample) | 1.4% | 2.4% |
| Standard Deviation (Population) | 1.4% | 2.4% |
Similar Demographics by Ambulatory Disability
Demographics Similar to Immigrants from Latin America by Ambulatory Disability
In terms of ambulatory disability, the demographic groups most similar to Immigrants from Latin America are Immigrants from Mexico (6.3%, a difference of 0.010%), Canadian (6.3%, a difference of 0.010%), Yugoslavian (6.3%, a difference of 0.010%), Guamanian/Chamorro (6.3%, a difference of 0.050%), and Mexican American Indian (6.3%, a difference of 0.13%).
| Demographics | Rating | Rank | Ambulatory Disability |
| Bangladeshis | 14.2 /100 | #208 | Poor 6.3% |
| Immigrants | Iraq | 14.0 /100 | #209 | Poor 6.3% |
| Immigrants | Laos | 13.2 /100 | #210 | Poor 6.3% |
| Samoans | 12.1 /100 | #211 | Poor 6.3% |
| Mexican American Indians | 12.0 /100 | #212 | Poor 6.3% |
| Japanese | 12.0 /100 | #213 | Poor 6.3% |
| Immigrants | Mexico | 11.0 /100 | #214 | Poor 6.3% |
| Immigrants | Latin America | 11.0 /100 | #215 | Poor 6.3% |
| Canadians | 10.9 /100 | #216 | Poor 6.3% |
| Yugoslavians | 10.9 /100 | #217 | Poor 6.3% |
| Guamanians/Chamorros | 10.6 /100 | #218 | Poor 6.3% |
| Indonesians | 9.9 /100 | #219 | Tragic 6.3% |
| Immigrants | Albania | 9.6 /100 | #220 | Tragic 6.3% |
| Hungarians | 9.6 /100 | #221 | Tragic 6.3% |
| German Russians | 9.4 /100 | #222 | Tragic 6.3% |
Demographics Similar to Natives/Alaskans by Ambulatory Disability
In terms of ambulatory disability, the demographic groups most similar to Natives/Alaskans are Black/African American (7.5%, a difference of 0.010%), Comanche (7.5%, a difference of 0.12%), Navajo (7.5%, a difference of 0.20%), Hopi (7.6%, a difference of 0.94%), and Pueblo (7.6%, a difference of 0.98%).
| Demographics | Rating | Rank | Ambulatory Disability |
| Potawatomi | 0.0 /100 | #320 | Tragic 7.3% |
| Apache | 0.0 /100 | #321 | Tragic 7.4% |
| Osage | 0.0 /100 | #322 | Tragic 7.4% |
| Americans | 0.0 /100 | #323 | Tragic 7.4% |
| Navajo | 0.0 /100 | #324 | Tragic 7.5% |
| Comanche | 0.0 /100 | #325 | Tragic 7.5% |
| Blacks/African Americans | 0.0 /100 | #326 | Tragic 7.5% |
| Natives/Alaskans | 0.0 /100 | #327 | Tragic 7.5% |
| Hopi | 0.0 /100 | #328 | Tragic 7.6% |
| Pueblo | 0.0 /100 | #329 | Tragic 7.6% |
| Paiute | 0.0 /100 | #330 | Tragic 7.7% |
| Cajuns | 0.0 /100 | #331 | Tragic 7.8% |
| Menominee | 0.0 /100 | #332 | Tragic 7.8% |
| Cherokee | 0.0 /100 | #333 | Tragic 7.9% |
| Yuman | 0.0 /100 | #334 | Tragic 7.9% |