Immigrants from Latin America vs Lebanese Child Poverty Under the Age of 5
COMPARE
Immigrants from Latin America
Lebanese
Child Poverty Under the Age of 5
Child Poverty Under the Age of 5 Comparison
Immigrants from Latin America
Lebanese
21.2%
CHILD POVERTY UNDER THE AGE OF 5
0.0/ 100
METRIC RATING
286th/ 347
METRIC RANK
17.4%
CHILD POVERTY UNDER THE AGE OF 5
40.3/ 100
METRIC RATING
183rd/ 347
METRIC RANK
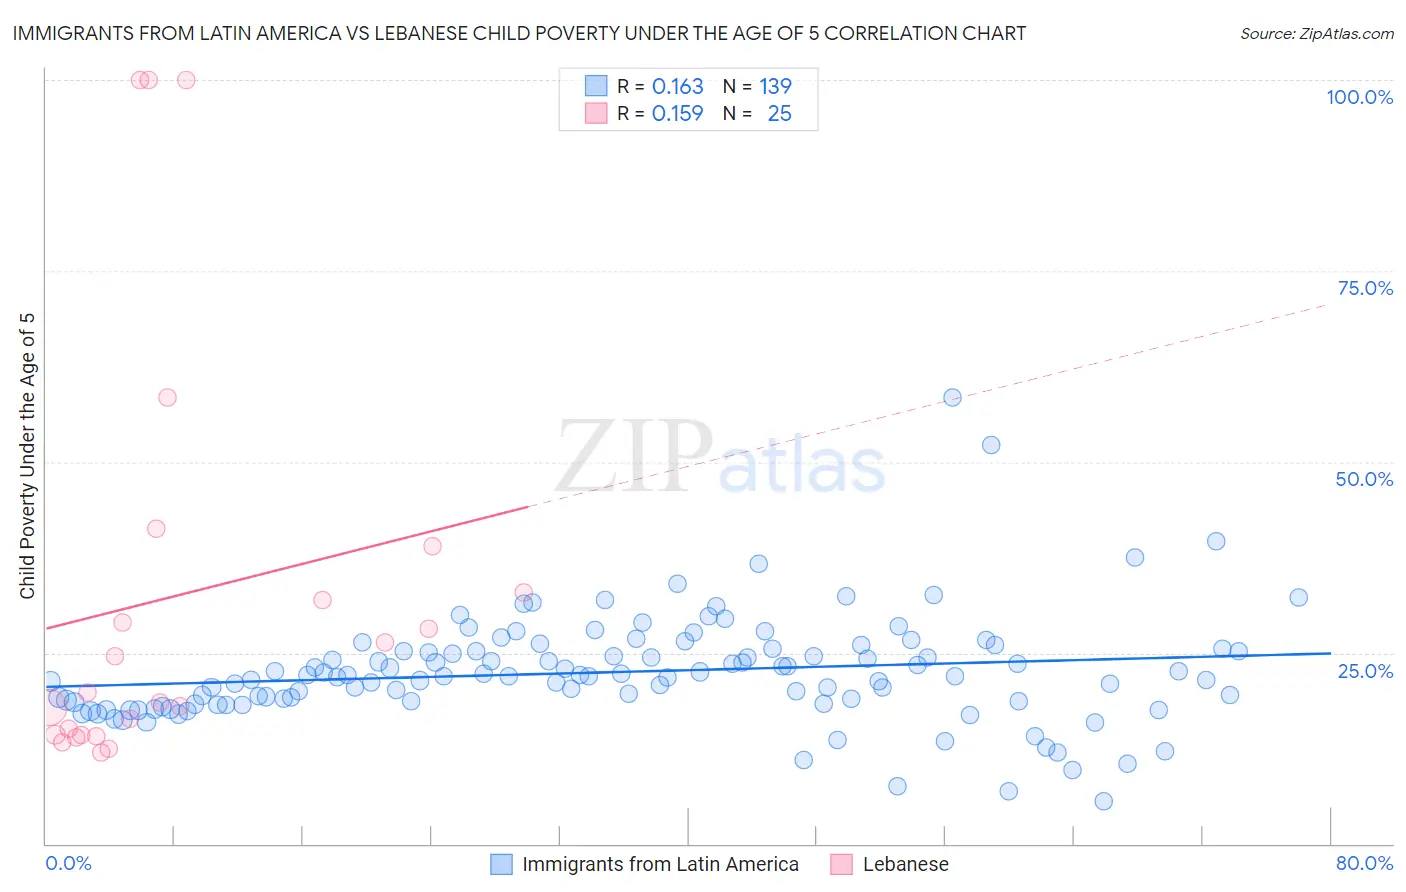
Immigrants from Latin America vs Lebanese Child Poverty Under the Age of 5 Correlation Chart
The statistical analysis conducted on geographies consisting of 523,296,541 people shows a poor positive correlation between the proportion of Immigrants from Latin America and poverty level among children under the age of 5 in the United States with a correlation coefficient (R) of 0.163 and weighted average of 21.2%. Similarly, the statistical analysis conducted on geographies consisting of 383,569,611 people shows a poor positive correlation between the proportion of Lebanese and poverty level among children under the age of 5 in the United States with a correlation coefficient (R) of 0.159 and weighted average of 17.4%, a difference of 22.0%.
Child Poverty Under the Age of 5 Correlation Summary
| Measurement | Immigrants from Latin America | Lebanese |
| Minimum | 5.6% | 12.0% |
| Maximum | 58.4% | 100.0% |
| Range | 52.7% | 88.0% |
| Mean | 22.5% | 32.4% |
| Median | 22.0% | 19.7% |
| Interquartile 25% (IQ1) | 18.5% | 14.2% |
| Interquartile 75% (IQ3) | 25.3% | 35.9% |
| Interquartile Range (IQR) | 6.8% | 21.6% |
| Standard Deviation (Sample) | 7.0% | 27.7% |
| Standard Deviation (Population) | 7.0% | 27.2% |
Similar Demographics by Child Poverty Under the Age of 5
Demographics Similar to Immigrants from Latin America by Child Poverty Under the Age of 5
In terms of child poverty under the age of 5, the demographic groups most similar to Immigrants from Latin America are Haitian (21.2%, a difference of 0.080%), Immigrants from Zaire (21.3%, a difference of 0.090%), Immigrants from Senegal (21.3%, a difference of 0.27%), Immigrants from Haiti (21.3%, a difference of 0.34%), and Somali (21.1%, a difference of 0.55%).
| Demographics | Rating | Rank | Child Poverty Under the Age of 5 |
| Sub-Saharan Africans | 0.0 /100 | #279 | Tragic 20.8% |
| French American Indians | 0.0 /100 | #280 | Tragic 20.8% |
| Senegalese | 0.0 /100 | #281 | Tragic 20.9% |
| Potawatomi | 0.0 /100 | #282 | Tragic 21.0% |
| Comanche | 0.0 /100 | #283 | Tragic 21.0% |
| Somalis | 0.0 /100 | #284 | Tragic 21.1% |
| Haitians | 0.0 /100 | #285 | Tragic 21.2% |
| Immigrants | Latin America | 0.0 /100 | #286 | Tragic 21.2% |
| Immigrants | Zaire | 0.0 /100 | #287 | Tragic 21.3% |
| Immigrants | Senegal | 0.0 /100 | #288 | Tragic 21.3% |
| Immigrants | Haiti | 0.0 /100 | #289 | Tragic 21.3% |
| Immigrants | Caribbean | 0.0 /100 | #290 | Tragic 21.4% |
| British West Indians | 0.0 /100 | #291 | Tragic 21.4% |
| Immigrants | Somalia | 0.0 /100 | #292 | Tragic 21.6% |
| Mexicans | 0.0 /100 | #293 | Tragic 21.6% |
Demographics Similar to Lebanese by Child Poverty Under the Age of 5
In terms of child poverty under the age of 5, the demographic groups most similar to Lebanese are Arab (17.4%, a difference of 0.040%), Immigrants from Germany (17.4%, a difference of 0.070%), Hawaiian (17.4%, a difference of 0.12%), South American Indian (17.4%, a difference of 0.12%), and Immigrants from Costa Rica (17.4%, a difference of 0.14%).
| Demographics | Rating | Rank | Child Poverty Under the Age of 5 |
| Immigrants | Iraq | 45.2 /100 | #176 | Average 17.3% |
| Immigrants | Sierra Leone | 43.6 /100 | #177 | Average 17.3% |
| Immigrants | Cameroon | 42.7 /100 | #178 | Average 17.4% |
| Hawaiians | 41.5 /100 | #179 | Average 17.4% |
| South American Indians | 41.4 /100 | #180 | Average 17.4% |
| Immigrants | Germany | 41.0 /100 | #181 | Average 17.4% |
| Arabs | 40.7 /100 | #182 | Average 17.4% |
| Lebanese | 40.3 /100 | #183 | Average 17.4% |
| Immigrants | Costa Rica | 39.0 /100 | #184 | Fair 17.4% |
| Immigrants | Armenia | 38.0 /100 | #185 | Fair 17.5% |
| Immigrants | Bosnia and Herzegovina | 35.0 /100 | #186 | Fair 17.5% |
| Kenyans | 34.7 /100 | #187 | Fair 17.5% |
| Carpatho Rusyns | 33.6 /100 | #188 | Fair 17.5% |
| French | 33.6 /100 | #189 | Fair 17.5% |
| Slovaks | 29.2 /100 | #190 | Fair 17.6% |