Immigrants from Korea vs Immigrants from Dominican Republic Disability Age Under 5
COMPARE
Immigrants from Korea
Immigrants from Dominican Republic
Disability Age Under 5
Disability Age Under 5 Comparison
Immigrants from Korea
Immigrants from Dominican Republic
1.1%
DISABILITY AGE UNDER 5
98.8/ 100
METRIC RATING
65th/ 347
METRIC RANK
1.1%
DISABILITY AGE UNDER 5
97.5/ 100
METRIC RATING
88th/ 347
METRIC RANK
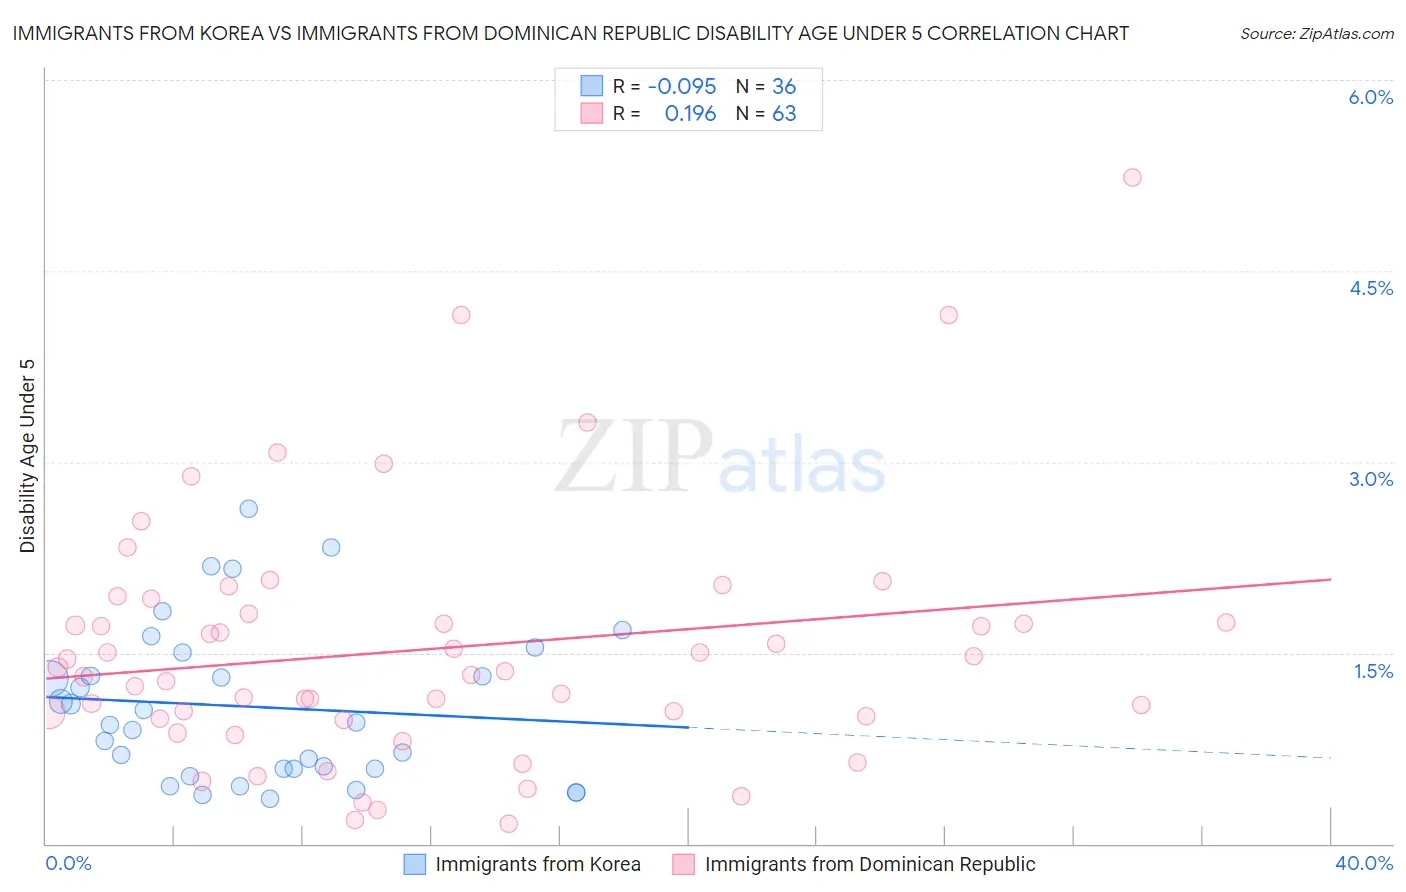
Immigrants from Korea vs Immigrants from Dominican Republic Disability Age Under 5 Correlation Chart
The statistical analysis conducted on geographies consisting of 221,993,484 people shows a slight negative correlation between the proportion of Immigrants from Korea and percentage of population with a disability under the age of 5 in the United States with a correlation coefficient (R) of -0.095 and weighted average of 1.1%. Similarly, the statistical analysis conducted on geographies consisting of 160,628,361 people shows a poor positive correlation between the proportion of Immigrants from Dominican Republic and percentage of population with a disability under the age of 5 in the United States with a correlation coefficient (R) of 0.196 and weighted average of 1.1%, a difference of 1.9%.
Disability Age Under 5 Correlation Summary
| Measurement | Immigrants from Korea | Immigrants from Dominican Republic |
| Minimum | 0.35% | 0.15% |
| Maximum | 2.6% | 5.2% |
| Range | 2.3% | 5.1% |
| Mean | 1.1% | 1.5% |
| Median | 0.95% | 1.4% |
| Interquartile 25% (IQ1) | 0.59% | 0.99% |
| Interquartile 75% (IQ3) | 1.4% | 1.8% |
| Interquartile Range (IQR) | 0.82% | 0.82% |
| Standard Deviation (Sample) | 0.61% | 0.97% |
| Standard Deviation (Population) | 0.60% | 0.97% |
Similar Demographics by Disability Age Under 5
Demographics Similar to Immigrants from Korea by Disability Age Under 5
In terms of disability age under 5, the demographic groups most similar to Immigrants from Korea are Immigrants from Indonesia (1.1%, a difference of 0.13%), Immigrants from Belize (1.1%, a difference of 0.19%), South African (1.1%, a difference of 0.23%), Israeli (1.1%, a difference of 0.26%), and Egyptian (1.1%, a difference of 0.34%).
| Demographics | Rating | Rank | Disability Age Under 5 |
| Immigrants | Egypt | 99.4 /100 | #58 | Exceptional 1.1% |
| Immigrants | Malaysia | 99.4 /100 | #59 | Exceptional 1.1% |
| Immigrants | Western Asia | 99.2 /100 | #60 | Exceptional 1.1% |
| Immigrants | Ethiopia | 99.2 /100 | #61 | Exceptional 1.1% |
| Immigrants | Switzerland | 99.2 /100 | #62 | Exceptional 1.1% |
| Immigrants | Vietnam | 99.1 /100 | #63 | Exceptional 1.1% |
| Egyptians | 98.9 /100 | #64 | Exceptional 1.1% |
| Immigrants | Korea | 98.8 /100 | #65 | Exceptional 1.1% |
| Immigrants | Indonesia | 98.7 /100 | #66 | Exceptional 1.1% |
| Immigrants | Belize | 98.7 /100 | #67 | Exceptional 1.1% |
| South Africans | 98.7 /100 | #68 | Exceptional 1.1% |
| Israelis | 98.7 /100 | #69 | Exceptional 1.1% |
| Immigrants | Ecuador | 98.6 /100 | #70 | Exceptional 1.1% |
| Trinidadians and Tobagonians | 98.6 /100 | #71 | Exceptional 1.1% |
| Burmese | 98.5 /100 | #72 | Exceptional 1.1% |
Demographics Similar to Immigrants from Dominican Republic by Disability Age Under 5
In terms of disability age under 5, the demographic groups most similar to Immigrants from Dominican Republic are Ugandan (1.1%, a difference of 0.020%), Okinawan (1.1%, a difference of 0.040%), Sudanese (1.1%, a difference of 0.17%), Immigrants from Zaire (1.1%, a difference of 0.25%), and Ethiopian (1.1%, a difference of 0.28%).
| Demographics | Rating | Rank | Disability Age Under 5 |
| Turks | 98.0 /100 | #81 | Exceptional 1.1% |
| Immigrants | Jordan | 97.9 /100 | #82 | Exceptional 1.1% |
| Immigrants | Syria | 97.9 /100 | #83 | Exceptional 1.1% |
| Immigrants | Zaire | 97.8 /100 | #84 | Exceptional 1.1% |
| Sudanese | 97.7 /100 | #85 | Exceptional 1.1% |
| Okinawans | 97.6 /100 | #86 | Exceptional 1.1% |
| Ugandans | 97.5 /100 | #87 | Exceptional 1.1% |
| Immigrants | Dominican Republic | 97.5 /100 | #88 | Exceptional 1.1% |
| Ethiopians | 97.2 /100 | #89 | Exceptional 1.1% |
| Chinese | 97.2 /100 | #90 | Exceptional 1.1% |
| Albanians | 97.2 /100 | #91 | Exceptional 1.1% |
| Immigrants | Cuba | 97.0 /100 | #92 | Exceptional 1.1% |
| Spanish Americans | 96.9 /100 | #93 | Exceptional 1.1% |
| Sri Lankans | 96.8 /100 | #94 | Exceptional 1.1% |
| Immigrants | Moldova | 96.8 /100 | #95 | Exceptional 1.1% |