Immigrants from Korea vs Bhutanese Disability Age Under 5
COMPARE
Immigrants from Korea
Bhutanese
Disability Age Under 5
Disability Age Under 5 Comparison
Immigrants from Korea
Bhutanese
1.1%
DISABILITY AGE UNDER 5
98.8/ 100
METRIC RATING
65th/ 347
METRIC RANK
1.2%
DISABILITY AGE UNDER 5
92.5/ 100
METRIC RATING
119th/ 347
METRIC RANK
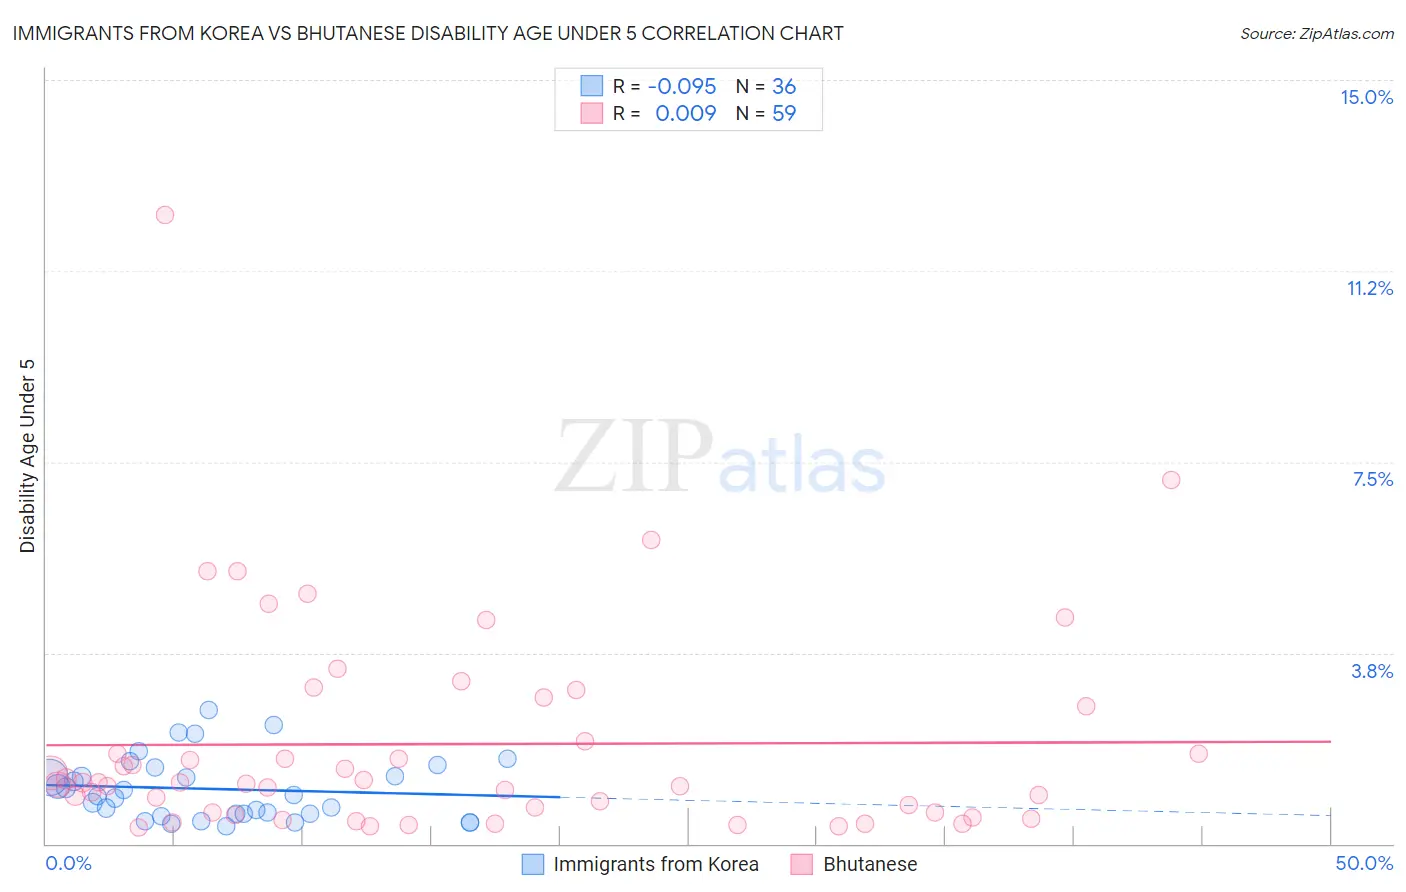
Immigrants from Korea vs Bhutanese Disability Age Under 5 Correlation Chart
The statistical analysis conducted on geographies consisting of 221,993,484 people shows a slight negative correlation between the proportion of Immigrants from Korea and percentage of population with a disability under the age of 5 in the United States with a correlation coefficient (R) of -0.095 and weighted average of 1.1%. Similarly, the statistical analysis conducted on geographies consisting of 235,474,976 people shows no correlation between the proportion of Bhutanese and percentage of population with a disability under the age of 5 in the United States with a correlation coefficient (R) of 0.009 and weighted average of 1.2%, a difference of 4.8%.
Disability Age Under 5 Correlation Summary
| Measurement | Immigrants from Korea | Bhutanese |
| Minimum | 0.35% | 0.32% |
| Maximum | 2.6% | 12.3% |
| Range | 2.3% | 12.0% |
| Mean | 1.1% | 2.0% |
| Median | 0.95% | 1.2% |
| Interquartile 25% (IQ1) | 0.59% | 0.60% |
| Interquartile 75% (IQ3) | 1.4% | 2.7% |
| Interquartile Range (IQR) | 0.82% | 2.1% |
| Standard Deviation (Sample) | 0.61% | 2.1% |
| Standard Deviation (Population) | 0.60% | 2.1% |
Similar Demographics by Disability Age Under 5
Demographics Similar to Immigrants from Korea by Disability Age Under 5
In terms of disability age under 5, the demographic groups most similar to Immigrants from Korea are Immigrants from Indonesia (1.1%, a difference of 0.13%), Immigrants from Belize (1.1%, a difference of 0.19%), South African (1.1%, a difference of 0.23%), Israeli (1.1%, a difference of 0.26%), and Egyptian (1.1%, a difference of 0.34%).
| Demographics | Rating | Rank | Disability Age Under 5 |
| Immigrants | Egypt | 99.4 /100 | #58 | Exceptional 1.1% |
| Immigrants | Malaysia | 99.4 /100 | #59 | Exceptional 1.1% |
| Immigrants | Western Asia | 99.2 /100 | #60 | Exceptional 1.1% |
| Immigrants | Ethiopia | 99.2 /100 | #61 | Exceptional 1.1% |
| Immigrants | Switzerland | 99.2 /100 | #62 | Exceptional 1.1% |
| Immigrants | Vietnam | 99.1 /100 | #63 | Exceptional 1.1% |
| Egyptians | 98.9 /100 | #64 | Exceptional 1.1% |
| Immigrants | Korea | 98.8 /100 | #65 | Exceptional 1.1% |
| Immigrants | Indonesia | 98.7 /100 | #66 | Exceptional 1.1% |
| Immigrants | Belize | 98.7 /100 | #67 | Exceptional 1.1% |
| South Africans | 98.7 /100 | #68 | Exceptional 1.1% |
| Israelis | 98.7 /100 | #69 | Exceptional 1.1% |
| Immigrants | Ecuador | 98.6 /100 | #70 | Exceptional 1.1% |
| Trinidadians and Tobagonians | 98.6 /100 | #71 | Exceptional 1.1% |
| Burmese | 98.5 /100 | #72 | Exceptional 1.1% |
Demographics Similar to Bhutanese by Disability Age Under 5
In terms of disability age under 5, the demographic groups most similar to Bhutanese are Immigrants from Eritrea (1.2%, a difference of 0.070%), Immigrants from Venezuela (1.2%, a difference of 0.34%), Immigrants from Senegal (1.2%, a difference of 0.35%), Immigrants from Philippines (1.2%, a difference of 0.37%), and Immigrants from Northern Africa (1.2%, a difference of 0.50%).
| Demographics | Rating | Rank | Disability Age Under 5 |
| Immigrants | Australia | 94.4 /100 | #112 | Exceptional 1.2% |
| Immigrants | Oceania | 94.2 /100 | #113 | Exceptional 1.2% |
| Belizeans | 93.9 /100 | #114 | Exceptional 1.2% |
| Immigrants | Caribbean | 93.8 /100 | #115 | Exceptional 1.2% |
| Immigrants | Northern Africa | 93.8 /100 | #116 | Exceptional 1.2% |
| Immigrants | Philippines | 93.5 /100 | #117 | Exceptional 1.2% |
| Immigrants | Venezuela | 93.4 /100 | #118 | Exceptional 1.2% |
| Bhutanese | 92.5 /100 | #119 | Exceptional 1.2% |
| Immigrants | Eritrea | 92.3 /100 | #120 | Exceptional 1.2% |
| Immigrants | Senegal | 91.4 /100 | #121 | Exceptional 1.2% |
| Aleuts | 90.7 /100 | #122 | Exceptional 1.2% |
| Zimbabweans | 90.6 /100 | #123 | Exceptional 1.2% |
| Immigrants | Cambodia | 90.5 /100 | #124 | Exceptional 1.2% |
| Japanese | 90.3 /100 | #125 | Exceptional 1.2% |
| Central Americans | 89.7 /100 | #126 | Excellent 1.2% |