Immigrants from Kenya vs Kiowa Disability
COMPARE
Immigrants from Kenya
Kiowa
Disability
Disability Comparison
Immigrants from Kenya
Kiowa
11.6%
DISABILITY
72.1/ 100
METRIC RATING
151st/ 347
METRIC RANK
15.6%
DISABILITY
0.0/ 100
METRIC RATING
342nd/ 347
METRIC RANK
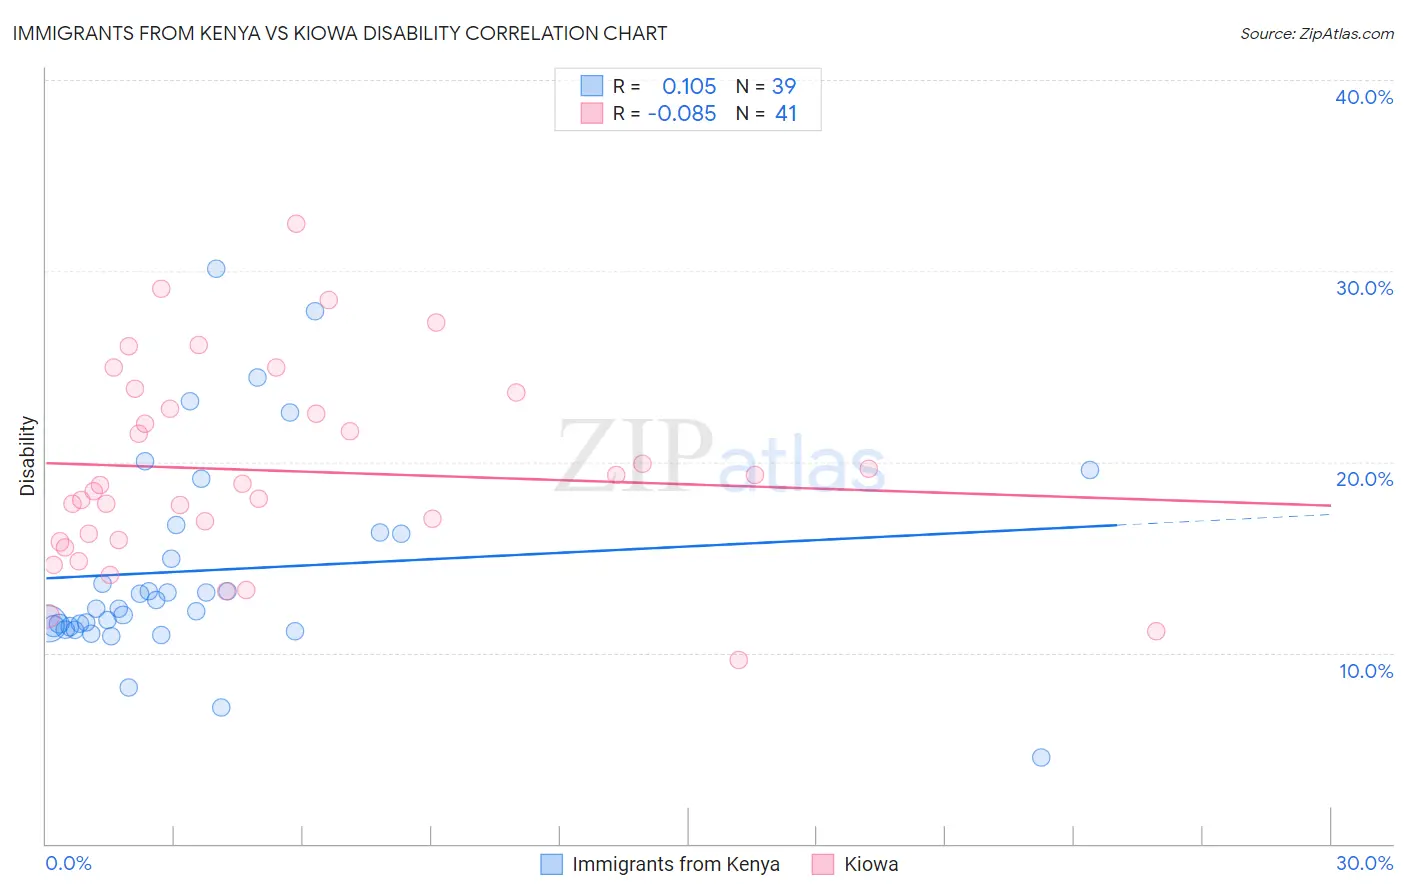
Immigrants from Kenya vs Kiowa Disability Correlation Chart
The statistical analysis conducted on geographies consisting of 218,058,395 people shows a poor positive correlation between the proportion of Immigrants from Kenya and percentage of population with a disability in the United States with a correlation coefficient (R) of 0.105 and weighted average of 11.6%. Similarly, the statistical analysis conducted on geographies consisting of 56,099,396 people shows a slight negative correlation between the proportion of Kiowa and percentage of population with a disability in the United States with a correlation coefficient (R) of -0.085 and weighted average of 15.6%, a difference of 34.7%.
Disability Correlation Summary
| Measurement | Immigrants from Kenya | Kiowa |
| Minimum | 4.5% | 9.6% |
| Maximum | 30.1% | 32.5% |
| Range | 25.6% | 22.9% |
| Mean | 14.3% | 19.5% |
| Median | 12.3% | 18.8% |
| Interquartile 25% (IQ1) | 11.4% | 15.9% |
| Interquartile 75% (IQ3) | 16.3% | 23.2% |
| Interquartile Range (IQR) | 4.9% | 7.3% |
| Standard Deviation (Sample) | 5.4% | 5.2% |
| Standard Deviation (Population) | 5.3% | 5.1% |
Similar Demographics by Disability
Demographics Similar to Immigrants from Kenya by Disability
In terms of disability, the demographic groups most similar to Immigrants from Kenya are Immigrants from Moldova (11.6%, a difference of 0.0%), Romanian (11.6%, a difference of 0.030%), Immigrants from Ghana (11.6%, a difference of 0.050%), Immigrants from Guatemala (11.6%, a difference of 0.050%), and Immigrants from Norway (11.6%, a difference of 0.060%).
| Demographics | Rating | Rank | Disability |
| Australians | 82.5 /100 | #144 | Excellent 11.5% |
| Nigerians | 81.3 /100 | #145 | Excellent 11.5% |
| Immigrants | Hungary | 79.0 /100 | #146 | Good 11.5% |
| Immigrants | Ukraine | 77.6 /100 | #147 | Good 11.5% |
| Sudanese | 77.1 /100 | #148 | Good 11.5% |
| Immigrants | Norway | 73.2 /100 | #149 | Good 11.6% |
| Romanians | 72.7 /100 | #150 | Good 11.6% |
| Immigrants | Kenya | 72.1 /100 | #151 | Good 11.6% |
| Immigrants | Moldova | 72.0 /100 | #152 | Good 11.6% |
| Immigrants | Ghana | 71.2 /100 | #153 | Good 11.6% |
| Immigrants | Guatemala | 71.1 /100 | #154 | Good 11.6% |
| Immigrants | Netherlands | 69.8 /100 | #155 | Good 11.6% |
| Immigrants | Fiji | 69.5 /100 | #156 | Good 11.6% |
| Immigrants | Middle Africa | 69.5 /100 | #157 | Good 11.6% |
| Armenians | 65.9 /100 | #158 | Good 11.6% |
Demographics Similar to Kiowa by Disability
In terms of disability, the demographic groups most similar to Kiowa are Creek (15.6%, a difference of 0.010%), Lumbee (15.5%, a difference of 0.45%), Colville (15.8%, a difference of 1.2%), Choctaw (15.4%, a difference of 1.3%), and Chickasaw (15.2%, a difference of 2.8%).
| Demographics | Rating | Rank | Disability |
| Cajuns | 0.0 /100 | #333 | Tragic 14.6% |
| Yuman | 0.0 /100 | #334 | Tragic 14.6% |
| Tohono O'odham | 0.0 /100 | #335 | Tragic 14.8% |
| Cherokee | 0.0 /100 | #336 | Tragic 14.8% |
| Seminole | 0.0 /100 | #337 | Tragic 14.9% |
| Dutch West Indians | 0.0 /100 | #338 | Tragic 14.9% |
| Chickasaw | 0.0 /100 | #339 | Tragic 15.2% |
| Choctaw | 0.0 /100 | #340 | Tragic 15.4% |
| Lumbee | 0.0 /100 | #341 | Tragic 15.5% |
| Kiowa | 0.0 /100 | #342 | Tragic 15.6% |
| Creek | 0.0 /100 | #343 | Tragic 15.6% |
| Colville | 0.0 /100 | #344 | Tragic 15.8% |
| Puerto Ricans | 0.0 /100 | #345 | Tragic 16.1% |
| Tsimshian | 0.0 /100 | #346 | Tragic 16.1% |
| Houma | 0.0 /100 | #347 | Tragic 17.1% |