Immigrants from Kenya vs Ethiopian In Labor Force | Age 16-19
COMPARE
Immigrants from Kenya
Ethiopian
In Labor Force | Age 16-19
In Labor Force | Age 16-19 Comparison
Immigrants from Kenya
Ethiopians
40.5%
IN LABOR FORCE | AGE 16-19
100.0/ 100
METRIC RATING
53rd/ 347
METRIC RANK
38.2%
IN LABOR FORCE | AGE 16-19
97.4/ 100
METRIC RATING
121st/ 347
METRIC RANK
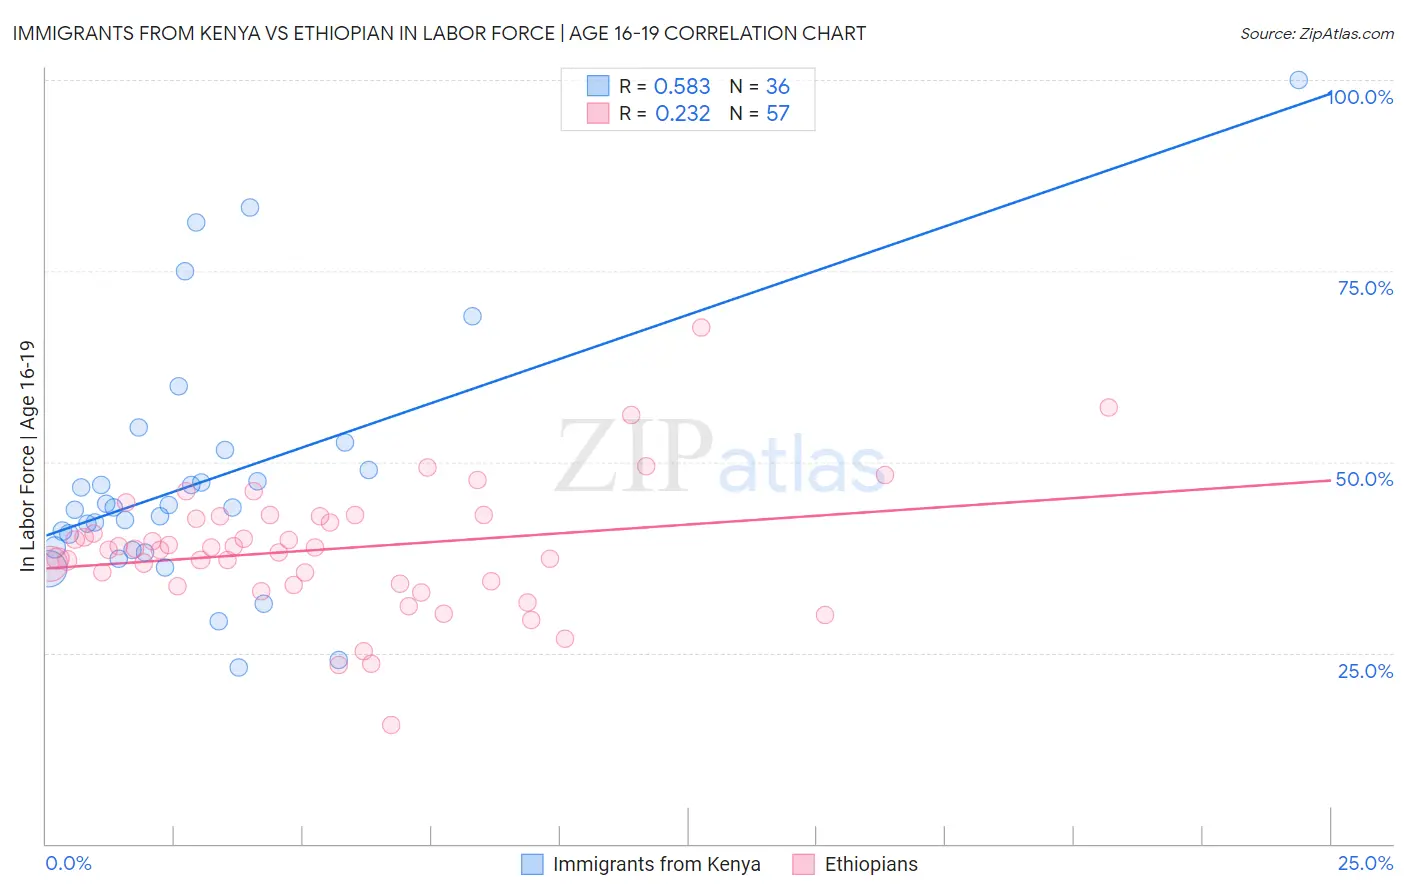
Immigrants from Kenya vs Ethiopian In Labor Force | Age 16-19 Correlation Chart
The statistical analysis conducted on geographies consisting of 218,036,354 people shows a substantial positive correlation between the proportion of Immigrants from Kenya and labor force participation rate among population between the ages 16 and 19 in the United States with a correlation coefficient (R) of 0.583 and weighted average of 40.5%. Similarly, the statistical analysis conducted on geographies consisting of 223,172,424 people shows a weak positive correlation between the proportion of Ethiopians and labor force participation rate among population between the ages 16 and 19 in the United States with a correlation coefficient (R) of 0.232 and weighted average of 38.2%, a difference of 5.9%.
In Labor Force | Age 16-19 Correlation Summary
| Measurement | Immigrants from Kenya | Ethiopian |
| Minimum | 23.0% | 15.6% |
| Maximum | 100.0% | 67.6% |
| Range | 77.0% | 52.0% |
| Mean | 47.7% | 38.6% |
| Median | 44.0% | 38.6% |
| Interquartile 25% (IQ1) | 38.6% | 34.0% |
| Interquartile 75% (IQ3) | 50.3% | 42.8% |
| Interquartile Range (IQR) | 11.7% | 8.9% |
| Standard Deviation (Sample) | 16.3% | 8.5% |
| Standard Deviation (Population) | 16.0% | 8.4% |
Similar Demographics by In Labor Force | Age 16-19
Demographics Similar to Immigrants from Kenya by In Labor Force | Age 16-19
In terms of in labor force | age 16-19, the demographic groups most similar to Immigrants from Kenya are Tlingit-Haida (40.5%, a difference of 0.030%), British (40.5%, a difference of 0.060%), Fijian (40.4%, a difference of 0.15%), Lithuanian (40.4%, a difference of 0.17%), and Aleut (40.4%, a difference of 0.19%).
| Demographics | Rating | Rank | In Labor Force | Age 16-19 |
| Immigrants | Sudan | 100.0 /100 | #46 | Exceptional 41.0% |
| Carpatho Rusyns | 100.0 /100 | #47 | Exceptional 40.8% |
| Icelanders | 100.0 /100 | #48 | Exceptional 40.8% |
| Cree | 100.0 /100 | #49 | Exceptional 40.8% |
| Indonesians | 100.0 /100 | #50 | Exceptional 40.7% |
| Immigrants | Zaire | 100.0 /100 | #51 | Exceptional 40.7% |
| Immigrants | Laos | 100.0 /100 | #52 | Exceptional 40.6% |
| Immigrants | Kenya | 100.0 /100 | #53 | Exceptional 40.5% |
| Tlingit-Haida | 100.0 /100 | #54 | Exceptional 40.5% |
| British | 100.0 /100 | #55 | Exceptional 40.5% |
| Fijians | 100.0 /100 | #56 | Exceptional 40.4% |
| Lithuanians | 100.0 /100 | #57 | Exceptional 40.4% |
| Aleuts | 100.0 /100 | #58 | Exceptional 40.4% |
| Slavs | 100.0 /100 | #59 | Exceptional 40.4% |
| Immigrants | Eastern Africa | 100.0 /100 | #60 | Exceptional 40.4% |
Demographics Similar to Ethiopians by In Labor Force | Age 16-19
In terms of in labor force | age 16-19, the demographic groups most similar to Ethiopians are Guamanian/Chamorro (38.2%, a difference of 0.030%), Ukrainian (38.3%, a difference of 0.11%), Assyrian/Chaldean/Syriac (38.3%, a difference of 0.19%), Immigrants from Nepal (38.3%, a difference of 0.21%), and Chickasaw (38.3%, a difference of 0.22%).
| Demographics | Rating | Rank | In Labor Force | Age 16-19 |
| Hawaiians | 98.2 /100 | #114 | Exceptional 38.4% |
| Bulgarians | 97.9 /100 | #115 | Exceptional 38.3% |
| Colville | 97.9 /100 | #116 | Exceptional 38.3% |
| Chickasaw | 97.8 /100 | #117 | Exceptional 38.3% |
| Immigrants | Nepal | 97.8 /100 | #118 | Exceptional 38.3% |
| Assyrians/Chaldeans/Syriacs | 97.8 /100 | #119 | Exceptional 38.3% |
| Ukrainians | 97.6 /100 | #120 | Exceptional 38.3% |
| Ethiopians | 97.4 /100 | #121 | Exceptional 38.2% |
| Guamanians/Chamorros | 97.4 /100 | #122 | Exceptional 38.2% |
| Seminole | 96.7 /100 | #123 | Exceptional 38.1% |
| Immigrants | England | 96.4 /100 | #124 | Exceptional 38.1% |
| Immigrants | Africa | 96.1 /100 | #125 | Exceptional 38.0% |
| Africans | 95.6 /100 | #126 | Exceptional 38.0% |
| Choctaw | 95.6 /100 | #127 | Exceptional 38.0% |
| New Zealanders | 95.6 /100 | #128 | Exceptional 38.0% |