Immigrants from Kenya vs Puget Sound Salish Disability
COMPARE
Immigrants from Kenya
Puget Sound Salish
Disability
Disability Comparison
Immigrants from Kenya
Puget Sound Salish
11.6%
DISABILITY
72.1/ 100
METRIC RATING
151st/ 347
METRIC RANK
13.7%
DISABILITY
0.0/ 100
METRIC RATING
315th/ 347
METRIC RANK
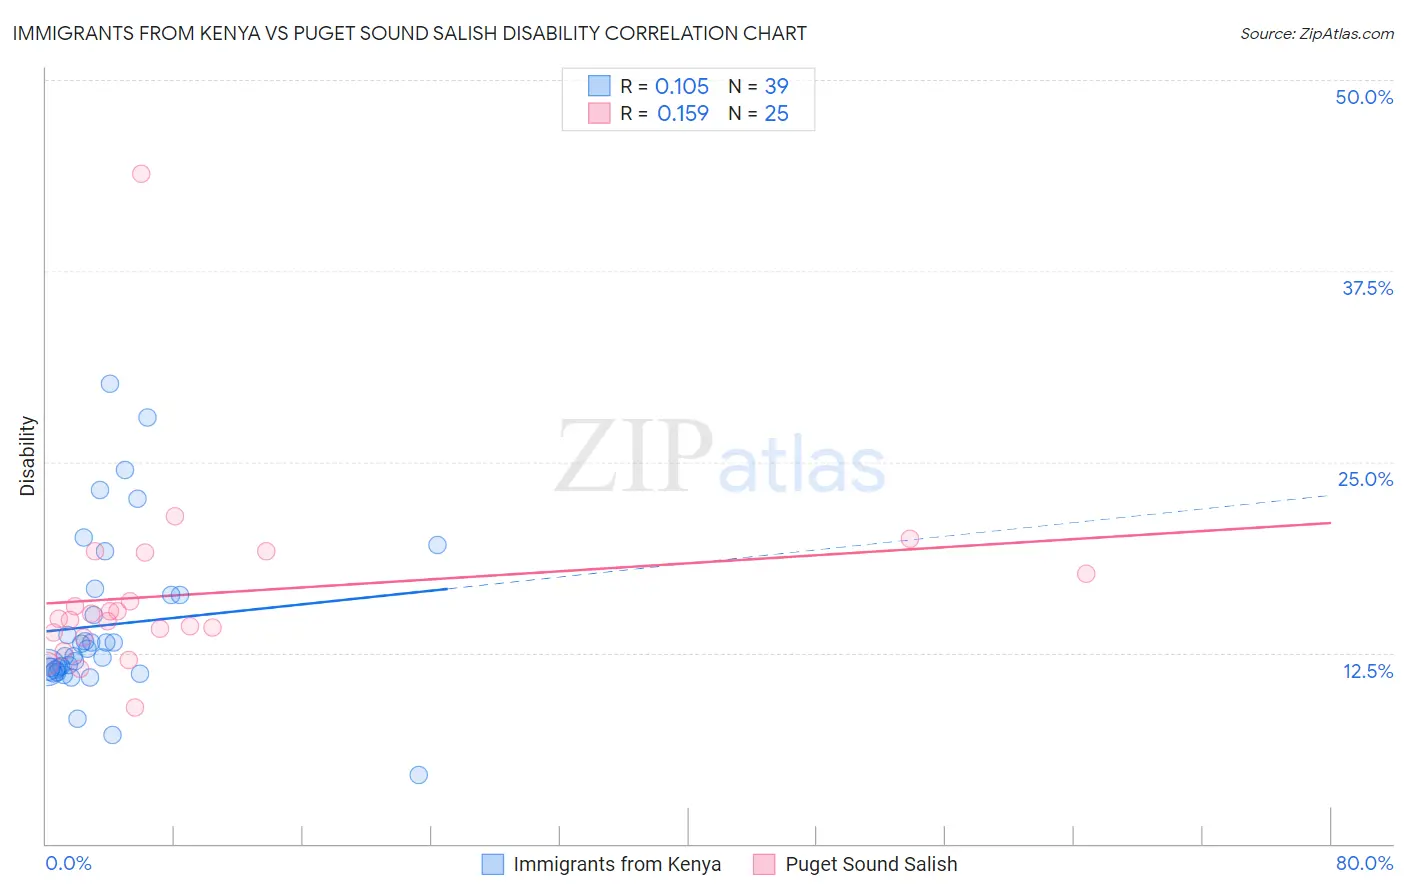
Immigrants from Kenya vs Puget Sound Salish Disability Correlation Chart
The statistical analysis conducted on geographies consisting of 218,058,395 people shows a poor positive correlation between the proportion of Immigrants from Kenya and percentage of population with a disability in the United States with a correlation coefficient (R) of 0.105 and weighted average of 11.6%. Similarly, the statistical analysis conducted on geographies consisting of 46,152,398 people shows a poor positive correlation between the proportion of Puget Sound Salish and percentage of population with a disability in the United States with a correlation coefficient (R) of 0.159 and weighted average of 13.7%, a difference of 18.3%.
Disability Correlation Summary
| Measurement | Immigrants from Kenya | Puget Sound Salish |
| Minimum | 4.5% | 8.9% |
| Maximum | 30.1% | 43.9% |
| Range | 25.6% | 35.0% |
| Mean | 14.3% | 16.3% |
| Median | 12.3% | 14.8% |
| Interquartile 25% (IQ1) | 11.4% | 13.7% |
| Interquartile 75% (IQ3) | 16.3% | 18.4% |
| Interquartile Range (IQR) | 4.9% | 4.7% |
| Standard Deviation (Sample) | 5.4% | 6.4% |
| Standard Deviation (Population) | 5.3% | 6.3% |
Similar Demographics by Disability
Demographics Similar to Immigrants from Kenya by Disability
In terms of disability, the demographic groups most similar to Immigrants from Kenya are Immigrants from Moldova (11.6%, a difference of 0.0%), Romanian (11.6%, a difference of 0.030%), Immigrants from Ghana (11.6%, a difference of 0.050%), Immigrants from Guatemala (11.6%, a difference of 0.050%), and Immigrants from Norway (11.6%, a difference of 0.060%).
| Demographics | Rating | Rank | Disability |
| Australians | 82.5 /100 | #144 | Excellent 11.5% |
| Nigerians | 81.3 /100 | #145 | Excellent 11.5% |
| Immigrants | Hungary | 79.0 /100 | #146 | Good 11.5% |
| Immigrants | Ukraine | 77.6 /100 | #147 | Good 11.5% |
| Sudanese | 77.1 /100 | #148 | Good 11.5% |
| Immigrants | Norway | 73.2 /100 | #149 | Good 11.6% |
| Romanians | 72.7 /100 | #150 | Good 11.6% |
| Immigrants | Kenya | 72.1 /100 | #151 | Good 11.6% |
| Immigrants | Moldova | 72.0 /100 | #152 | Good 11.6% |
| Immigrants | Ghana | 71.2 /100 | #153 | Good 11.6% |
| Immigrants | Guatemala | 71.1 /100 | #154 | Good 11.6% |
| Immigrants | Netherlands | 69.8 /100 | #155 | Good 11.6% |
| Immigrants | Fiji | 69.5 /100 | #156 | Good 11.6% |
| Immigrants | Middle Africa | 69.5 /100 | #157 | Good 11.6% |
| Armenians | 65.9 /100 | #158 | Good 11.6% |
Demographics Similar to Puget Sound Salish by Disability
In terms of disability, the demographic groups most similar to Puget Sound Salish are Black/African American (13.7%, a difference of 0.0%), Pima (13.7%, a difference of 0.030%), Immigrants from Cabo Verde (13.7%, a difference of 0.030%), Cree (13.7%, a difference of 0.040%), and Spanish American (13.6%, a difference of 0.39%).
| Demographics | Rating | Rank | Disability |
| French American Indians | 0.0 /100 | #308 | Tragic 13.5% |
| Tlingit-Haida | 0.0 /100 | #309 | Tragic 13.5% |
| Blackfeet | 0.0 /100 | #310 | Tragic 13.6% |
| Delaware | 0.0 /100 | #311 | Tragic 13.6% |
| Spanish Americans | 0.0 /100 | #312 | Tragic 13.6% |
| Cree | 0.0 /100 | #313 | Tragic 13.7% |
| Blacks/African Americans | 0.0 /100 | #314 | Tragic 13.7% |
| Puget Sound Salish | 0.0 /100 | #315 | Tragic 13.7% |
| Pima | 0.0 /100 | #316 | Tragic 13.7% |
| Immigrants | Cabo Verde | 0.0 /100 | #317 | Tragic 13.7% |
| Menominee | 0.0 /100 | #318 | Tragic 13.8% |
| Iroquois | 0.0 /100 | #319 | Tragic 13.8% |
| Apache | 0.0 /100 | #320 | Tragic 13.9% |
| Paiute | 0.0 /100 | #321 | Tragic 13.9% |
| Americans | 0.0 /100 | #322 | Tragic 13.9% |