Immigrants from Jamaica vs Houma Unemployment Among Women with Children Ages 6 to 17 years
COMPARE
Immigrants from Jamaica
Houma
Unemployment Among Women with Children Ages 6 to 17 years
Unemployment Among Women with Children Ages 6 to 17 years Comparison
Immigrants from Jamaica
Houma
9.5%
UNEMPLOYMENT AMONG WOMEN WITH CHILDREN AGES 6 TO 17 YEARS
0.3/ 100
METRIC RATING
266th/ 347
METRIC RANK
12.5%
UNEMPLOYMENT AMONG WOMEN WITH CHILDREN AGES 6 TO 17 YEARS
0.0/ 100
METRIC RATING
336th/ 347
METRIC RANK
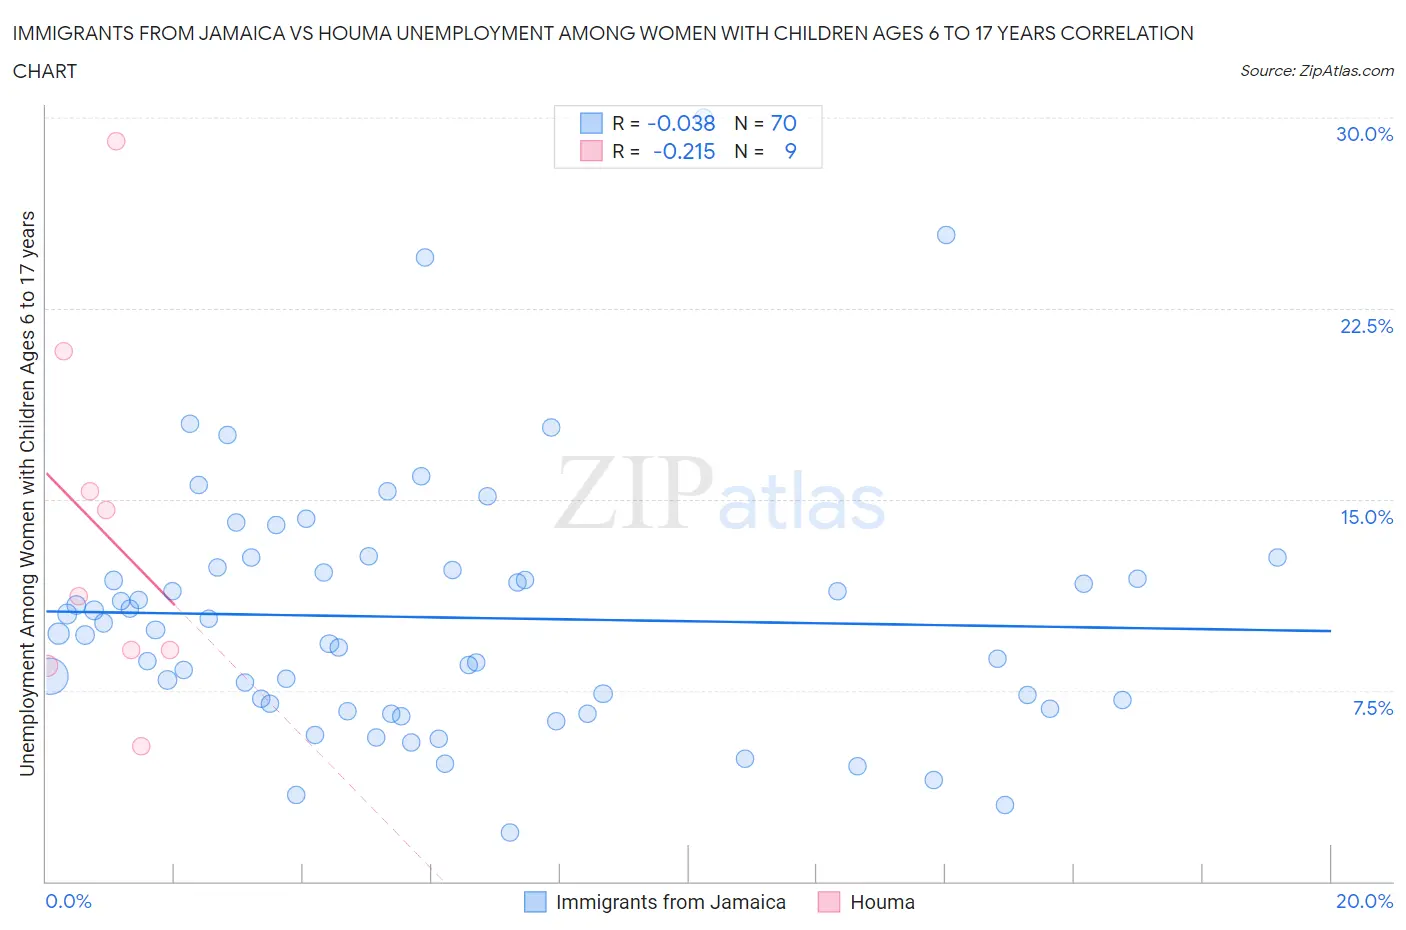
Immigrants from Jamaica vs Houma Unemployment Among Women with Children Ages 6 to 17 years Correlation Chart
The statistical analysis conducted on geographies consisting of 232,133,917 people shows no correlation between the proportion of Immigrants from Jamaica and unemployment rate among women with children between the ages 6 and 17 in the United States with a correlation coefficient (R) of -0.038 and weighted average of 9.5%. Similarly, the statistical analysis conducted on geographies consisting of 33,838,816 people shows a weak negative correlation between the proportion of Houma and unemployment rate among women with children between the ages 6 and 17 in the United States with a correlation coefficient (R) of -0.215 and weighted average of 12.5%, a difference of 30.7%.
Unemployment Among Women with Children Ages 6 to 17 years Correlation Summary
| Measurement | Immigrants from Jamaica | Houma |
| Minimum | 1.9% | 5.3% |
| Maximum | 30.0% | 29.1% |
| Range | 28.1% | 23.8% |
| Mean | 10.4% | 13.7% |
| Median | 9.8% | 11.2% |
| Interquartile 25% (IQ1) | 7.0% | 8.8% |
| Interquartile 75% (IQ3) | 12.2% | 18.1% |
| Interquartile Range (IQR) | 5.3% | 9.3% |
| Standard Deviation (Sample) | 5.0% | 7.4% |
| Standard Deviation (Population) | 5.0% | 7.0% |
Similar Demographics by Unemployment Among Women with Children Ages 6 to 17 years
Demographics Similar to Immigrants from Jamaica by Unemployment Among Women with Children Ages 6 to 17 years
In terms of unemployment among women with children ages 6 to 17 years, the demographic groups most similar to Immigrants from Jamaica are Irish (9.5%, a difference of 0.020%), West Indian (9.5%, a difference of 0.16%), Immigrants from Ghana (9.5%, a difference of 0.20%), Ghanaian (9.6%, a difference of 0.41%), and Lebanese (9.5%, a difference of 0.44%).
| Demographics | Rating | Rank | Unemployment Among Women with Children Ages 6 to 17 years |
| Immigrants | Central America | 0.6 /100 | #259 | Tragic 9.5% |
| Italians | 0.6 /100 | #260 | Tragic 9.5% |
| South Americans | 0.5 /100 | #261 | Tragic 9.5% |
| Senegalese | 0.5 /100 | #262 | Tragic 9.5% |
| Lebanese | 0.5 /100 | #263 | Tragic 9.5% |
| Immigrants | Ghana | 0.4 /100 | #264 | Tragic 9.5% |
| West Indians | 0.4 /100 | #265 | Tragic 9.5% |
| Immigrants | Jamaica | 0.3 /100 | #266 | Tragic 9.5% |
| Irish | 0.3 /100 | #267 | Tragic 9.5% |
| Ghanaians | 0.2 /100 | #268 | Tragic 9.6% |
| Blackfeet | 0.2 /100 | #269 | Tragic 9.6% |
| Immigrants | Nicaragua | 0.2 /100 | #270 | Tragic 9.6% |
| Immigrants | Latin America | 0.1 /100 | #271 | Tragic 9.6% |
| Kiowa | 0.1 /100 | #272 | Tragic 9.6% |
| Whites/Caucasians | 0.1 /100 | #273 | Tragic 9.6% |
Demographics Similar to Houma by Unemployment Among Women with Children Ages 6 to 17 years
In terms of unemployment among women with children ages 6 to 17 years, the demographic groups most similar to Houma are Colville (12.3%, a difference of 0.97%), Immigrants from Yemen (12.7%, a difference of 1.9%), Hopi (12.9%, a difference of 3.4%), Ugandan (12.0%, a difference of 3.7%), and Sioux (13.2%, a difference of 6.2%).
| Demographics | Rating | Rank | Unemployment Among Women with Children Ages 6 to 17 years |
| Pennsylvania Germans | 0.0 /100 | #329 | Tragic 11.0% |
| Chippewa | 0.0 /100 | #330 | Tragic 11.1% |
| Blacks/African Americans | 0.0 /100 | #331 | Tragic 11.4% |
| Tsimshian | 0.0 /100 | #332 | Tragic 11.4% |
| Natives/Alaskans | 0.0 /100 | #333 | Tragic 11.5% |
| Ugandans | 0.0 /100 | #334 | Tragic 12.0% |
| Colville | 0.0 /100 | #335 | Tragic 12.3% |
| Houma | 0.0 /100 | #336 | Tragic 12.5% |
| Immigrants | Yemen | 0.0 /100 | #337 | Tragic 12.7% |
| Hopi | 0.0 /100 | #338 | Tragic 12.9% |
| Sioux | 0.0 /100 | #339 | Tragic 13.2% |
| Puerto Ricans | 0.0 /100 | #340 | Tragic 13.9% |
| Navajo | 0.0 /100 | #341 | Tragic 14.2% |
| Yuman | 0.0 /100 | #342 | Tragic 14.8% |
| Inupiat | 0.0 /100 | #343 | Tragic 14.9% |