Immigrants from Jamaica vs Houma Disability Age 35 to 64
COMPARE
Immigrants from Jamaica
Houma
Disability Age 35 to 64
Disability Age 35 to 64 Comparison
Immigrants from Jamaica
Houma
11.7%
DISABILITY AGE 35 TO 64
11.8/ 100
METRIC RATING
212th/ 347
METRIC RANK
18.7%
DISABILITY AGE 35 TO 64
0.0/ 100
METRIC RATING
347th/ 347
METRIC RANK
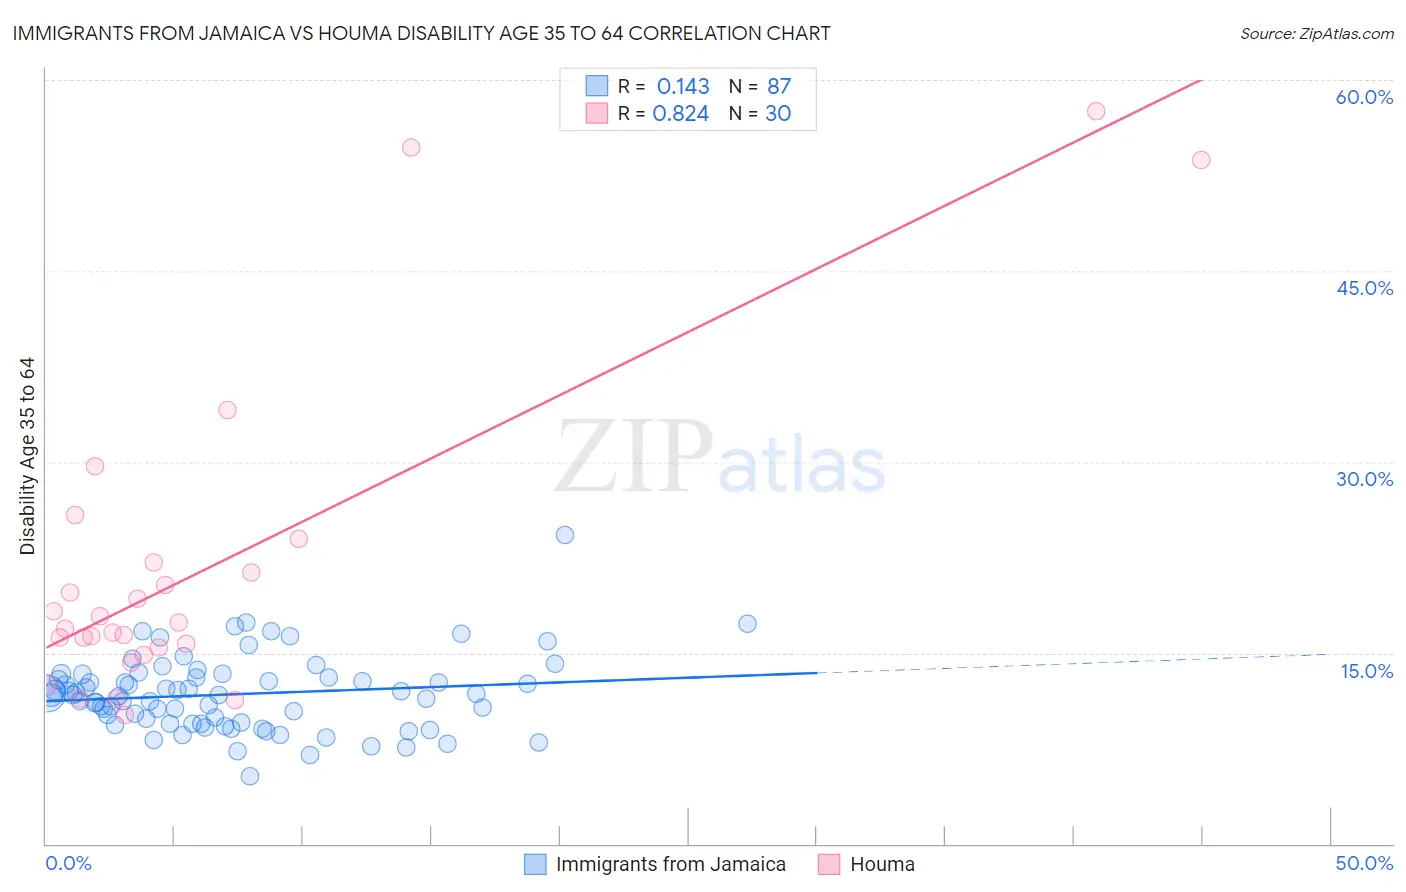
Immigrants from Jamaica vs Houma Disability Age 35 to 64 Correlation Chart
The statistical analysis conducted on geographies consisting of 301,572,097 people shows a poor positive correlation between the proportion of Immigrants from Jamaica and percentage of population with a disability between the ages 34 and 64 in the United States with a correlation coefficient (R) of 0.143 and weighted average of 11.7%. Similarly, the statistical analysis conducted on geographies consisting of 36,789,508 people shows a very strong positive correlation between the proportion of Houma and percentage of population with a disability between the ages 34 and 64 in the United States with a correlation coefficient (R) of 0.824 and weighted average of 18.7%, a difference of 59.4%.
Disability Age 35 to 64 Correlation Summary
| Measurement | Immigrants from Jamaica | Houma |
| Minimum | 5.3% | 10.2% |
| Maximum | 24.2% | 57.5% |
| Range | 18.9% | 47.3% |
| Mean | 11.7% | 21.7% |
| Median | 11.7% | 17.1% |
| Interquartile 25% (IQ1) | 9.4% | 15.4% |
| Interquartile 75% (IQ3) | 13.1% | 22.1% |
| Interquartile Range (IQR) | 3.7% | 6.7% |
| Standard Deviation (Sample) | 3.0% | 12.6% |
| Standard Deviation (Population) | 2.9% | 12.3% |
Similar Demographics by Disability Age 35 to 64
Demographics Similar to Immigrants from Jamaica by Disability Age 35 to 64
In terms of disability age 35 to 64, the demographic groups most similar to Immigrants from Jamaica are Yugoslavian (11.7%, a difference of 0.030%), Immigrants from Sudan (11.7%, a difference of 0.060%), Spanish American Indian (11.7%, a difference of 0.12%), Bahamian (11.8%, a difference of 0.21%), and Canadian (11.7%, a difference of 0.22%).
| Demographics | Rating | Rank | Disability Age 35 to 64 |
| Slavs | 15.5 /100 | #205 | Poor 11.7% |
| Native Hawaiians | 14.8 /100 | #206 | Poor 11.7% |
| Ghanaians | 14.8 /100 | #207 | Poor 11.7% |
| Guatemalans | 14.6 /100 | #208 | Poor 11.7% |
| Europeans | 13.5 /100 | #209 | Poor 11.7% |
| Belgians | 13.1 /100 | #210 | Poor 11.7% |
| Canadians | 13.0 /100 | #211 | Poor 11.7% |
| Immigrants | Jamaica | 11.8 /100 | #212 | Poor 11.7% |
| Yugoslavians | 11.6 /100 | #213 | Poor 11.7% |
| Immigrants | Sudan | 11.4 /100 | #214 | Poor 11.7% |
| Spanish American Indians | 11.1 /100 | #215 | Poor 11.7% |
| Bahamians | 10.7 /100 | #216 | Poor 11.8% |
| Barbadians | 9.5 /100 | #217 | Tragic 11.8% |
| Immigrants | Bahamas | 9.2 /100 | #218 | Tragic 11.8% |
| Czechoslovakians | 9.0 /100 | #219 | Tragic 11.8% |
Demographics Similar to Houma by Disability Age 35 to 64
In terms of disability age 35 to 64, the demographic groups most similar to Houma are Lumbee (17.6%, a difference of 5.9%), Kiowa (17.4%, a difference of 7.7%), Yup'ik (16.9%, a difference of 10.3%), Creek (16.9%, a difference of 10.7%), and Tohono O'odham (16.7%, a difference of 11.6%).
| Demographics | Rating | Rank | Disability Age 35 to 64 |
| Yuman | 0.0 /100 | #333 | Tragic 15.8% |
| Colville | 0.0 /100 | #334 | Tragic 15.8% |
| Seminole | 0.0 /100 | #335 | Tragic 15.9% |
| Menominee | 0.0 /100 | #336 | Tragic 15.9% |
| Puerto Ricans | 0.0 /100 | #337 | Tragic 15.9% |
| Chickasaw | 0.0 /100 | #338 | Tragic 16.1% |
| Pima | 0.0 /100 | #339 | Tragic 16.1% |
| Choctaw | 0.0 /100 | #340 | Tragic 16.4% |
| Tsimshian | 0.0 /100 | #341 | Tragic 16.7% |
| Tohono O'odham | 0.0 /100 | #342 | Tragic 16.7% |
| Creek | 0.0 /100 | #343 | Tragic 16.9% |
| Yup'ik | 0.0 /100 | #344 | Tragic 16.9% |
| Kiowa | 0.0 /100 | #345 | Tragic 17.4% |
| Lumbee | 0.0 /100 | #346 | Tragic 17.6% |
| Houma | 0.0 /100 | #347 | Tragic 18.7% |