Immigrants from Jamaica vs Chippewa Self-Care Disability
COMPARE
Immigrants from Jamaica
Chippewa
Self-Care Disability
Self-Care Disability Comparison
Immigrants from Jamaica
Chippewa
2.7%
SELF-CARE DISABILITY
0.0/ 100
METRIC RATING
287th/ 347
METRIC RANK
2.6%
SELF-CARE DISABILITY
0.2/ 100
METRIC RATING
260th/ 347
METRIC RANK
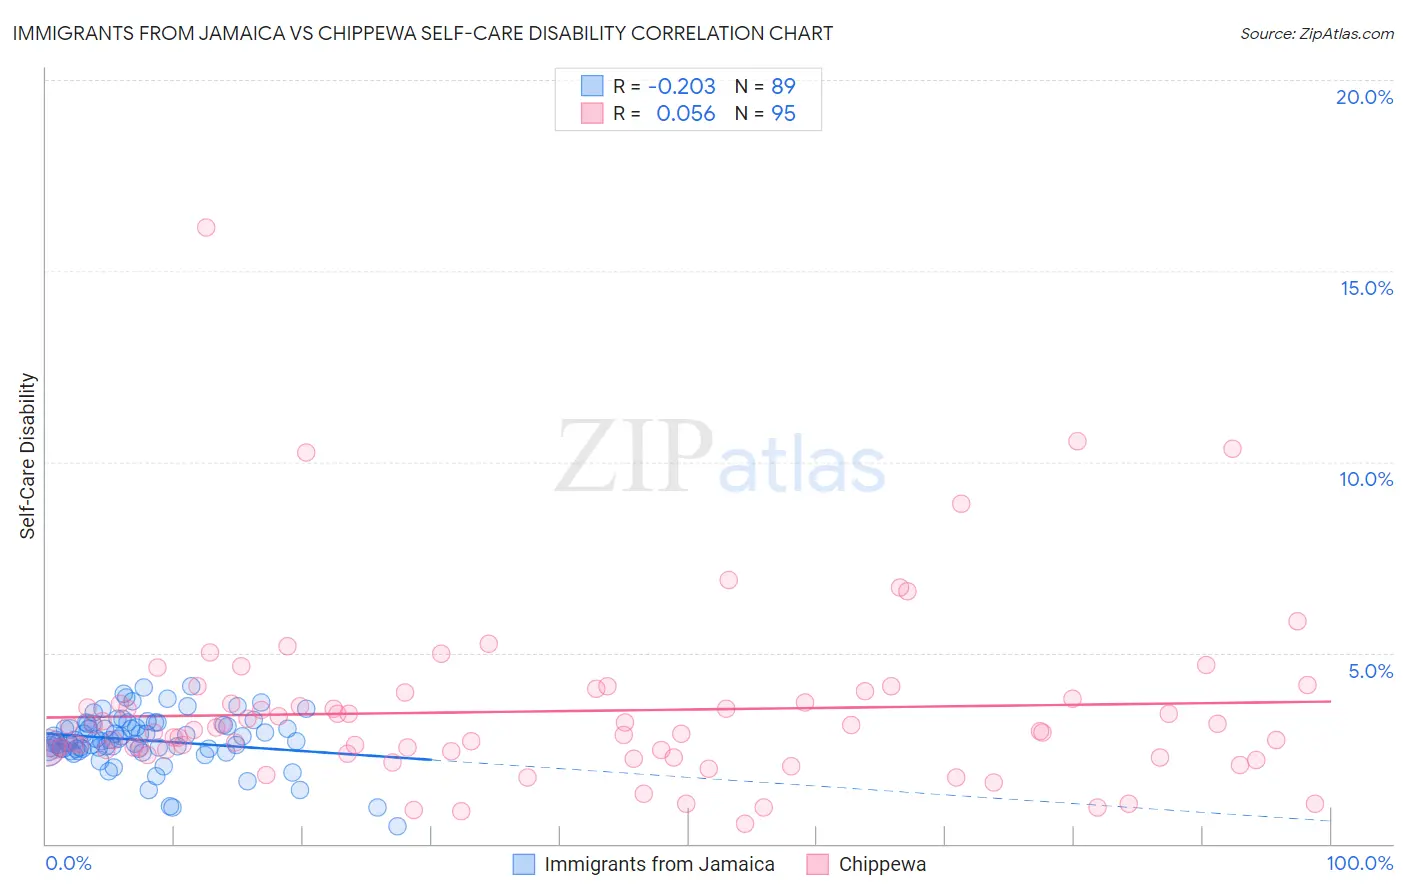
Immigrants from Jamaica vs Chippewa Self-Care Disability Correlation Chart
The statistical analysis conducted on geographies consisting of 301,430,789 people shows a weak negative correlation between the proportion of Immigrants from Jamaica and percentage of population with self-care disability in the United States with a correlation coefficient (R) of -0.203 and weighted average of 2.7%. Similarly, the statistical analysis conducted on geographies consisting of 214,880,520 people shows a slight positive correlation between the proportion of Chippewa and percentage of population with self-care disability in the United States with a correlation coefficient (R) of 0.056 and weighted average of 2.6%, a difference of 2.9%.
Self-Care Disability Correlation Summary
| Measurement | Immigrants from Jamaica | Chippewa |
| Minimum | 0.47% | 0.52% |
| Maximum | 4.1% | 16.1% |
| Range | 3.7% | 15.6% |
| Mean | 2.7% | 3.5% |
| Median | 2.7% | 2.9% |
| Interquartile 25% (IQ1) | 2.5% | 2.4% |
| Interquartile 75% (IQ3) | 3.1% | 3.8% |
| Interquartile Range (IQR) | 0.64% | 1.4% |
| Standard Deviation (Sample) | 0.68% | 2.3% |
| Standard Deviation (Population) | 0.68% | 2.3% |
Similar Demographics by Self-Care Disability
Demographics Similar to Immigrants from Jamaica by Self-Care Disability
In terms of self-care disability, the demographic groups most similar to Immigrants from Jamaica are Immigrants from Barbados (2.7%, a difference of 0.030%), African (2.7%, a difference of 0.14%), Cuban (2.7%, a difference of 0.29%), French American Indian (2.7%, a difference of 0.33%), and Guyanese (2.7%, a difference of 0.55%).
| Demographics | Rating | Rank | Self-Care Disability |
| Hispanics or Latinos | 0.1 /100 | #280 | Tragic 2.7% |
| Immigrants | Iraq | 0.0 /100 | #281 | Tragic 2.7% |
| Apache | 0.0 /100 | #282 | Tragic 2.7% |
| Delaware | 0.0 /100 | #283 | Tragic 2.7% |
| Fijians | 0.0 /100 | #284 | Tragic 2.7% |
| Jamaicans | 0.0 /100 | #285 | Tragic 2.7% |
| French American Indians | 0.0 /100 | #286 | Tragic 2.7% |
| Immigrants | Jamaica | 0.0 /100 | #287 | Tragic 2.7% |
| Immigrants | Barbados | 0.0 /100 | #288 | Tragic 2.7% |
| Africans | 0.0 /100 | #289 | Tragic 2.7% |
| Cubans | 0.0 /100 | #290 | Tragic 2.7% |
| Guyanese | 0.0 /100 | #291 | Tragic 2.7% |
| Central American Indians | 0.0 /100 | #292 | Tragic 2.7% |
| Belizeans | 0.0 /100 | #293 | Tragic 2.7% |
| Blackfeet | 0.0 /100 | #294 | Tragic 2.7% |
Demographics Similar to Chippewa by Self-Care Disability
In terms of self-care disability, the demographic groups most similar to Chippewa are Arapaho (2.6%, a difference of 0.020%), Immigrants from Belarus (2.6%, a difference of 0.040%), Nonimmigrants (2.6%, a difference of 0.11%), Shoshone (2.7%, a difference of 0.16%), and Potawatomi (2.6%, a difference of 0.18%).
| Demographics | Rating | Rank | Self-Care Disability |
| Immigrants | Haiti | 0.3 /100 | #253 | Tragic 2.6% |
| Haitians | 0.3 /100 | #254 | Tragic 2.6% |
| Tsimshian | 0.3 /100 | #255 | Tragic 2.6% |
| Immigrants | Central America | 0.3 /100 | #256 | Tragic 2.6% |
| Potawatomi | 0.3 /100 | #257 | Tragic 2.6% |
| Immigrants | Nonimmigrants | 0.3 /100 | #258 | Tragic 2.6% |
| Immigrants | Belarus | 0.2 /100 | #259 | Tragic 2.6% |
| Chippewa | 0.2 /100 | #260 | Tragic 2.6% |
| Arapaho | 0.2 /100 | #261 | Tragic 2.6% |
| Shoshone | 0.2 /100 | #262 | Tragic 2.7% |
| Immigrants | Latin America | 0.2 /100 | #263 | Tragic 2.7% |
| Immigrants | Iran | 0.2 /100 | #264 | Tragic 2.7% |
| Immigrants | Nicaragua | 0.2 /100 | #265 | Tragic 2.7% |
| Immigrants | Cambodia | 0.1 /100 | #266 | Tragic 2.7% |
| Yaqui | 0.1 /100 | #267 | Tragic 2.7% |