Immigrants from Jamaica vs Immigrants from Latvia Self-Care Disability
COMPARE
Immigrants from Jamaica
Immigrants from Latvia
Self-Care Disability
Self-Care Disability Comparison
Immigrants from Jamaica
Immigrants from Latvia
2.7%
SELF-CARE DISABILITY
0.0/ 100
METRIC RATING
287th/ 347
METRIC RANK
2.4%
SELF-CARE DISABILITY
97.0/ 100
METRIC RATING
93rd/ 347
METRIC RANK
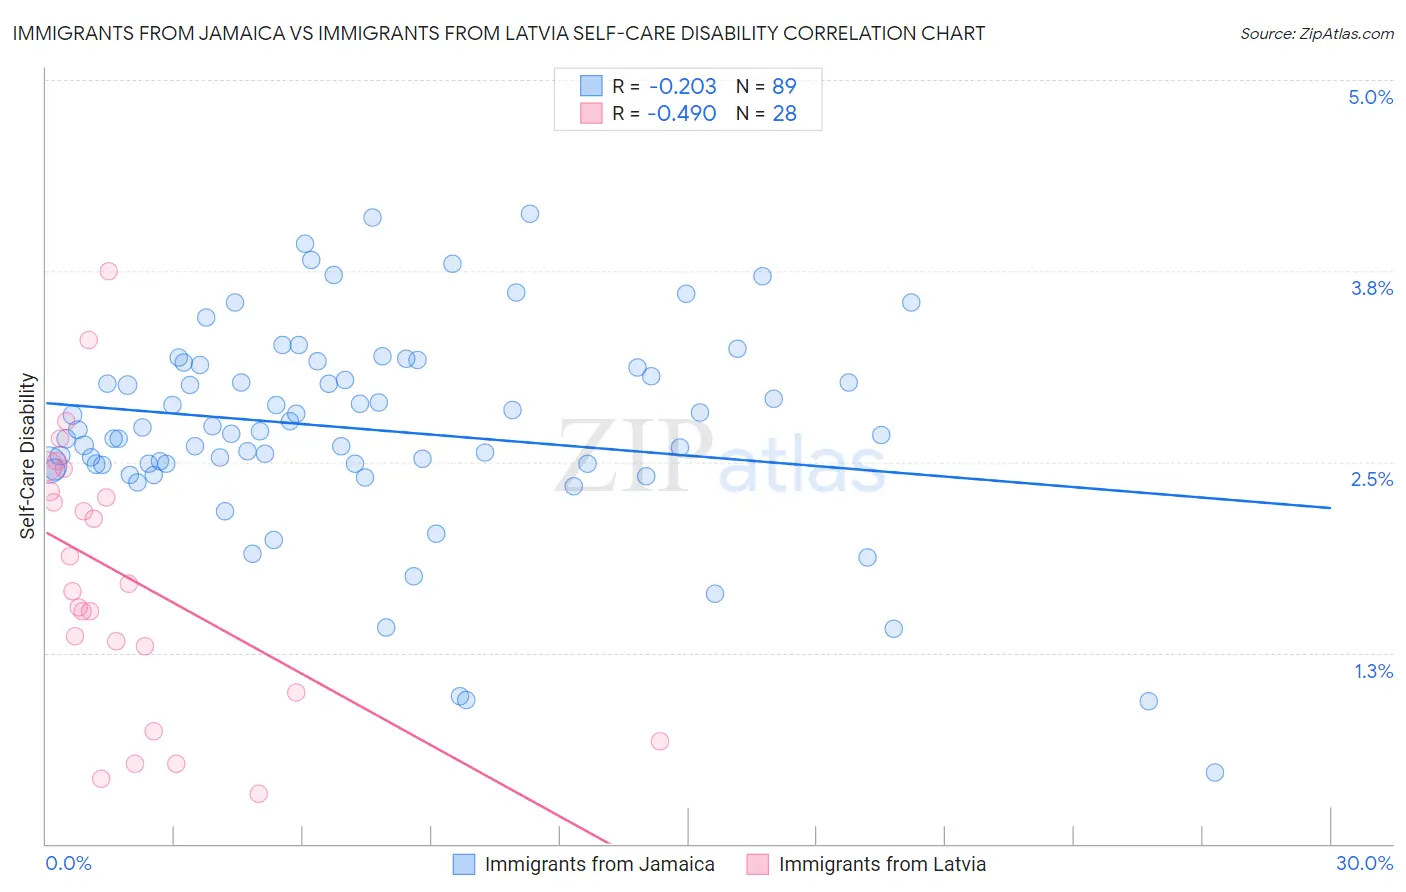
Immigrants from Jamaica vs Immigrants from Latvia Self-Care Disability Correlation Chart
The statistical analysis conducted on geographies consisting of 301,430,789 people shows a weak negative correlation between the proportion of Immigrants from Jamaica and percentage of population with self-care disability in the United States with a correlation coefficient (R) of -0.203 and weighted average of 2.7%. Similarly, the statistical analysis conducted on geographies consisting of 113,697,152 people shows a moderate negative correlation between the proportion of Immigrants from Latvia and percentage of population with self-care disability in the United States with a correlation coefficient (R) of -0.490 and weighted average of 2.4%, a difference of 15.1%.
Self-Care Disability Correlation Summary
| Measurement | Immigrants from Jamaica | Immigrants from Latvia |
| Minimum | 0.47% | 0.33% |
| Maximum | 4.1% | 3.7% |
| Range | 3.7% | 3.4% |
| Mean | 2.7% | 1.8% |
| Median | 2.7% | 1.7% |
| Interquartile 25% (IQ1) | 2.5% | 1.1% |
| Interquartile 75% (IQ3) | 3.1% | 2.4% |
| Interquartile Range (IQR) | 0.64% | 1.2% |
| Standard Deviation (Sample) | 0.68% | 0.89% |
| Standard Deviation (Population) | 0.68% | 0.87% |
Similar Demographics by Self-Care Disability
Demographics Similar to Immigrants from Jamaica by Self-Care Disability
In terms of self-care disability, the demographic groups most similar to Immigrants from Jamaica are Immigrants from Barbados (2.7%, a difference of 0.030%), African (2.7%, a difference of 0.14%), Cuban (2.7%, a difference of 0.29%), French American Indian (2.7%, a difference of 0.33%), and Guyanese (2.7%, a difference of 0.55%).
| Demographics | Rating | Rank | Self-Care Disability |
| Hispanics or Latinos | 0.1 /100 | #280 | Tragic 2.7% |
| Immigrants | Iraq | 0.0 /100 | #281 | Tragic 2.7% |
| Apache | 0.0 /100 | #282 | Tragic 2.7% |
| Delaware | 0.0 /100 | #283 | Tragic 2.7% |
| Fijians | 0.0 /100 | #284 | Tragic 2.7% |
| Jamaicans | 0.0 /100 | #285 | Tragic 2.7% |
| French American Indians | 0.0 /100 | #286 | Tragic 2.7% |
| Immigrants | Jamaica | 0.0 /100 | #287 | Tragic 2.7% |
| Immigrants | Barbados | 0.0 /100 | #288 | Tragic 2.7% |
| Africans | 0.0 /100 | #289 | Tragic 2.7% |
| Cubans | 0.0 /100 | #290 | Tragic 2.7% |
| Guyanese | 0.0 /100 | #291 | Tragic 2.7% |
| Central American Indians | 0.0 /100 | #292 | Tragic 2.7% |
| Belizeans | 0.0 /100 | #293 | Tragic 2.7% |
| Blackfeet | 0.0 /100 | #294 | Tragic 2.7% |
Demographics Similar to Immigrants from Latvia by Self-Care Disability
In terms of self-care disability, the demographic groups most similar to Immigrants from Latvia are Macedonian (2.4%, a difference of 0.040%), Immigrants from Asia (2.4%, a difference of 0.050%), Immigrants from Chile (2.4%, a difference of 0.11%), Swiss (2.4%, a difference of 0.16%), and Icelander (2.4%, a difference of 0.19%).
| Demographics | Rating | Rank | Self-Care Disability |
| Immigrants | Northern Africa | 98.2 /100 | #86 | Exceptional 2.3% |
| Sierra Leoneans | 98.0 /100 | #87 | Exceptional 2.4% |
| Lithuanians | 98.0 /100 | #88 | Exceptional 2.4% |
| Immigrants | Congo | 98.0 /100 | #89 | Exceptional 2.4% |
| Immigrants | Czechoslovakia | 97.7 /100 | #90 | Exceptional 2.4% |
| Immigrants | Jordan | 97.7 /100 | #91 | Exceptional 2.4% |
| Icelanders | 97.4 /100 | #92 | Exceptional 2.4% |
| Immigrants | Latvia | 97.0 /100 | #93 | Exceptional 2.4% |
| Macedonians | 96.9 /100 | #94 | Exceptional 2.4% |
| Immigrants | Asia | 96.9 /100 | #95 | Exceptional 2.4% |
| Immigrants | Chile | 96.7 /100 | #96 | Exceptional 2.4% |
| Swiss | 96.6 /100 | #97 | Exceptional 2.4% |
| Immigrants | Poland | 96.4 /100 | #98 | Exceptional 2.4% |
| Immigrants | Israel | 96.1 /100 | #99 | Exceptional 2.4% |
| Europeans | 95.8 /100 | #100 | Exceptional 2.4% |