Immigrants from Jamaica vs Yugoslavian Self-Care Disability
COMPARE
Immigrants from Jamaica
Yugoslavian
Self-Care Disability
Self-Care Disability Comparison
Immigrants from Jamaica
Yugoslavians
2.7%
SELF-CARE DISABILITY
0.0/ 100
METRIC RATING
287th/ 347
METRIC RANK
2.5%
SELF-CARE DISABILITY
36.1/ 100
METRIC RATING
184th/ 347
METRIC RANK
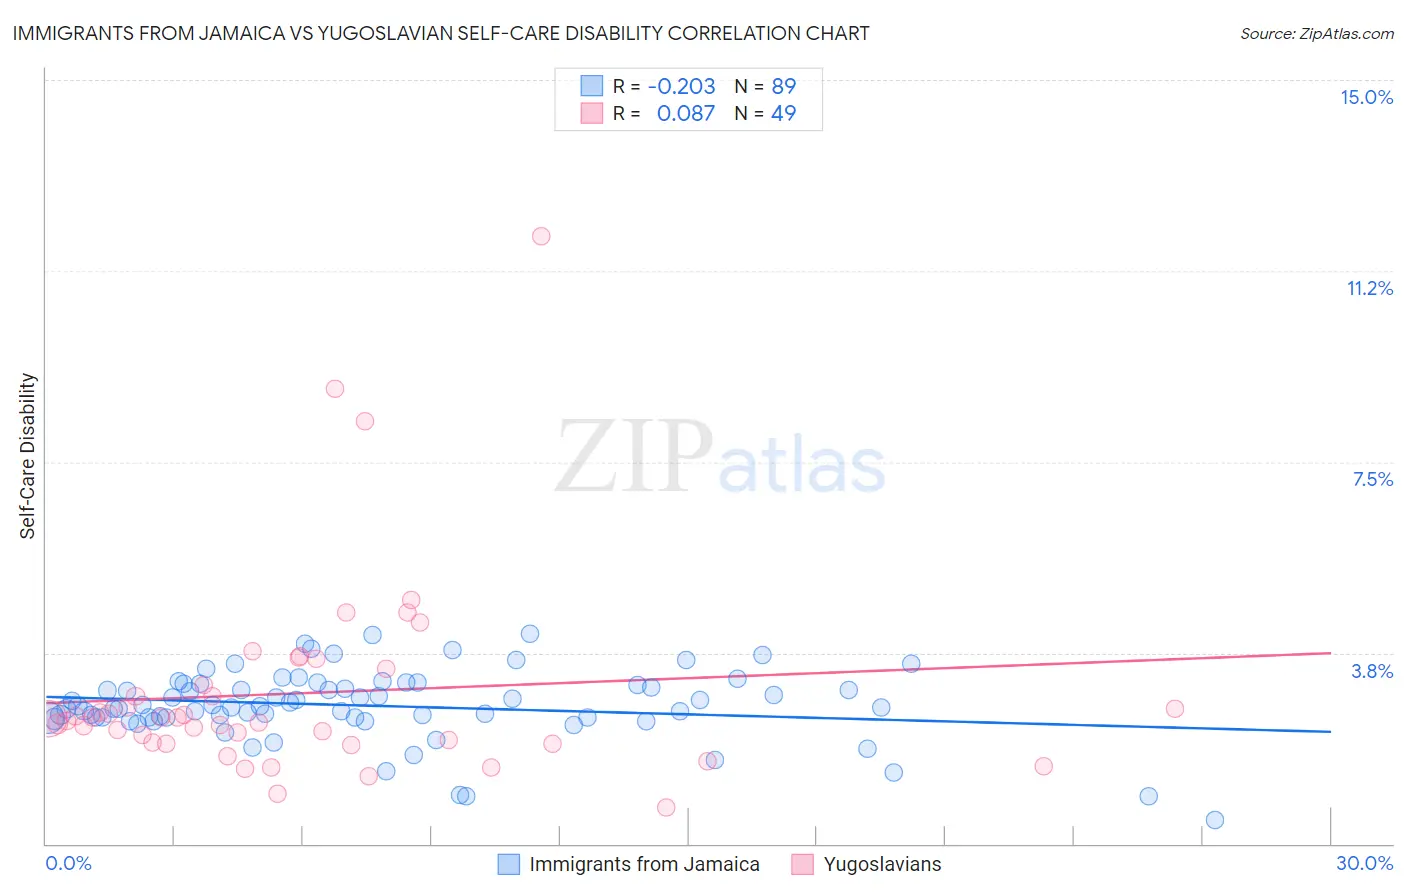
Immigrants from Jamaica vs Yugoslavian Self-Care Disability Correlation Chart
The statistical analysis conducted on geographies consisting of 301,430,789 people shows a weak negative correlation between the proportion of Immigrants from Jamaica and percentage of population with self-care disability in the United States with a correlation coefficient (R) of -0.203 and weighted average of 2.7%. Similarly, the statistical analysis conducted on geographies consisting of 285,516,060 people shows a slight positive correlation between the proportion of Yugoslavians and percentage of population with self-care disability in the United States with a correlation coefficient (R) of 0.087 and weighted average of 2.5%, a difference of 9.6%.
Self-Care Disability Correlation Summary
| Measurement | Immigrants from Jamaica | Yugoslavian |
| Minimum | 0.47% | 0.70% |
| Maximum | 4.1% | 11.9% |
| Range | 3.7% | 11.2% |
| Mean | 2.7% | 3.0% |
| Median | 2.7% | 2.5% |
| Interquartile 25% (IQ1) | 2.5% | 2.0% |
| Interquartile 75% (IQ3) | 3.1% | 3.3% |
| Interquartile Range (IQR) | 0.64% | 1.3% |
| Standard Deviation (Sample) | 0.68% | 2.0% |
| Standard Deviation (Population) | 0.68% | 2.0% |
Similar Demographics by Self-Care Disability
Demographics Similar to Immigrants from Jamaica by Self-Care Disability
In terms of self-care disability, the demographic groups most similar to Immigrants from Jamaica are Immigrants from Barbados (2.7%, a difference of 0.030%), African (2.7%, a difference of 0.14%), Cuban (2.7%, a difference of 0.29%), French American Indian (2.7%, a difference of 0.33%), and Guyanese (2.7%, a difference of 0.55%).
| Demographics | Rating | Rank | Self-Care Disability |
| Hispanics or Latinos | 0.1 /100 | #280 | Tragic 2.7% |
| Immigrants | Iraq | 0.0 /100 | #281 | Tragic 2.7% |
| Apache | 0.0 /100 | #282 | Tragic 2.7% |
| Delaware | 0.0 /100 | #283 | Tragic 2.7% |
| Fijians | 0.0 /100 | #284 | Tragic 2.7% |
| Jamaicans | 0.0 /100 | #285 | Tragic 2.7% |
| French American Indians | 0.0 /100 | #286 | Tragic 2.7% |
| Immigrants | Jamaica | 0.0 /100 | #287 | Tragic 2.7% |
| Immigrants | Barbados | 0.0 /100 | #288 | Tragic 2.7% |
| Africans | 0.0 /100 | #289 | Tragic 2.7% |
| Cubans | 0.0 /100 | #290 | Tragic 2.7% |
| Guyanese | 0.0 /100 | #291 | Tragic 2.7% |
| Central American Indians | 0.0 /100 | #292 | Tragic 2.7% |
| Belizeans | 0.0 /100 | #293 | Tragic 2.7% |
| Blackfeet | 0.0 /100 | #294 | Tragic 2.7% |
Demographics Similar to Yugoslavians by Self-Care Disability
In terms of self-care disability, the demographic groups most similar to Yugoslavians are Salvadoran (2.5%, a difference of 0.020%), Maltese (2.5%, a difference of 0.070%), Slavic (2.5%, a difference of 0.090%), Immigrants from El Salvador (2.5%, a difference of 0.17%), and Ghanaian (2.5%, a difference of 0.21%).
| Demographics | Rating | Rank | Self-Care Disability |
| Immigrants | Kazakhstan | 46.7 /100 | #177 | Average 2.5% |
| English | 46.2 /100 | #178 | Average 2.5% |
| Hungarians | 45.5 /100 | #179 | Average 2.5% |
| Indonesians | 41.2 /100 | #180 | Average 2.5% |
| Ghanaians | 40.4 /100 | #181 | Average 2.5% |
| Maltese | 37.5 /100 | #182 | Fair 2.5% |
| Salvadorans | 36.4 /100 | #183 | Fair 2.5% |
| Yugoslavians | 36.1 /100 | #184 | Fair 2.5% |
| Slavs | 34.3 /100 | #185 | Fair 2.5% |
| Immigrants | El Salvador | 33.0 /100 | #186 | Fair 2.5% |
| Irish | 28.7 /100 | #187 | Fair 2.5% |
| Immigrants | Oceania | 28.3 /100 | #188 | Fair 2.5% |
| Immigrants | Eastern Europe | 28.0 /100 | #189 | Fair 2.5% |
| Sioux | 24.6 /100 | #190 | Fair 2.5% |
| Moroccans | 22.9 /100 | #191 | Fair 2.5% |