Immigrants from Oceania vs Delaware Disability
COMPARE
Immigrants from Oceania
Delaware
Disability
Disability Comparison
Immigrants from Oceania
Delaware
11.8%
DISABILITY
34.3/ 100
METRIC RATING
181st/ 347
METRIC RANK
13.6%
DISABILITY
0.0/ 100
METRIC RATING
311th/ 347
METRIC RANK
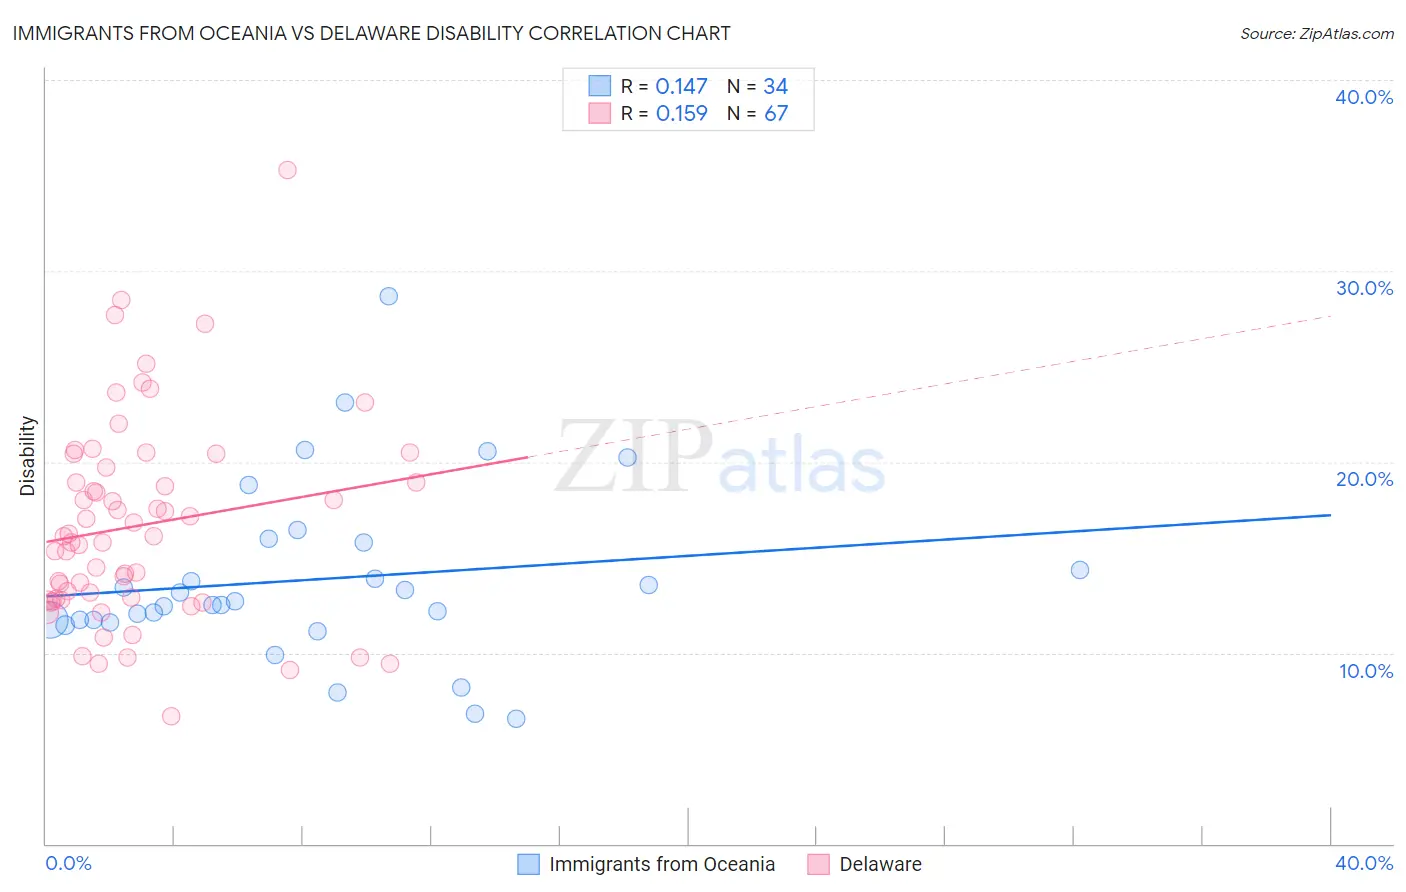
Immigrants from Oceania vs Delaware Disability Correlation Chart
The statistical analysis conducted on geographies consisting of 305,494,892 people shows a poor positive correlation between the proportion of Immigrants from Oceania and percentage of population with a disability in the United States with a correlation coefficient (R) of 0.147 and weighted average of 11.8%. Similarly, the statistical analysis conducted on geographies consisting of 96,240,981 people shows a poor positive correlation between the proportion of Delaware and percentage of population with a disability in the United States with a correlation coefficient (R) of 0.159 and weighted average of 13.6%, a difference of 15.5%.
Disability Correlation Summary
| Measurement | Immigrants from Oceania | Delaware |
| Minimum | 6.6% | 6.7% |
| Maximum | 28.7% | 35.3% |
| Range | 22.1% | 28.6% |
| Mean | 13.8% | 16.7% |
| Median | 12.6% | 16.1% |
| Interquartile 25% (IQ1) | 11.7% | 12.8% |
| Interquartile 75% (IQ3) | 15.8% | 19.7% |
| Interquartile Range (IQR) | 4.1% | 6.9% |
| Standard Deviation (Sample) | 4.6% | 5.3% |
| Standard Deviation (Population) | 4.6% | 5.3% |
Similar Demographics by Disability
Demographics Similar to Immigrants from Oceania by Disability
In terms of disability, the demographic groups most similar to Immigrants from Oceania are Icelander (11.8%, a difference of 0.010%), Honduran (11.8%, a difference of 0.15%), Immigrants from Honduras (11.8%, a difference of 0.17%), Iraqi (11.8%, a difference of 0.21%), and Immigrants from Burma/Myanmar (11.8%, a difference of 0.30%).
| Demographics | Rating | Rank | Disability |
| Albanians | 50.0 /100 | #174 | Average 11.7% |
| Haitians | 48.6 /100 | #175 | Average 11.7% |
| Immigrants | Western Africa | 47.5 /100 | #176 | Average 11.7% |
| Immigrants | Central America | 46.6 /100 | #177 | Average 11.7% |
| Greeks | 46.2 /100 | #178 | Average 11.7% |
| Immigrants | Armenia | 41.9 /100 | #179 | Average 11.7% |
| Immigrants | Honduras | 37.8 /100 | #180 | Fair 11.8% |
| Immigrants | Oceania | 34.3 /100 | #181 | Fair 11.8% |
| Icelanders | 34.0 /100 | #182 | Fair 11.8% |
| Hondurans | 31.2 /100 | #183 | Fair 11.8% |
| Iraqis | 30.0 /100 | #184 | Fair 11.8% |
| Immigrants | Burma/Myanmar | 28.5 /100 | #185 | Fair 11.8% |
| Immigrants | Scotland | 28.2 /100 | #186 | Fair 11.8% |
| Lebanese | 27.9 /100 | #187 | Fair 11.8% |
| Immigrants | Mexico | 23.8 /100 | #188 | Fair 11.9% |
Demographics Similar to Delaware by Disability
In terms of disability, the demographic groups most similar to Delaware are Blackfeet (13.6%, a difference of 0.040%), Spanish American (13.6%, a difference of 0.24%), Tlingit-Haida (13.5%, a difference of 0.56%), Cree (13.7%, a difference of 0.59%), and Black/African American (13.7%, a difference of 0.63%).
| Demographics | Rating | Rank | Disability |
| Yakama | 0.0 /100 | #304 | Tragic 13.4% |
| French Canadians | 0.0 /100 | #305 | Tragic 13.4% |
| Cape Verdeans | 0.0 /100 | #306 | Tragic 13.5% |
| Shoshone | 0.0 /100 | #307 | Tragic 13.5% |
| French American Indians | 0.0 /100 | #308 | Tragic 13.5% |
| Tlingit-Haida | 0.0 /100 | #309 | Tragic 13.5% |
| Blackfeet | 0.0 /100 | #310 | Tragic 13.6% |
| Delaware | 0.0 /100 | #311 | Tragic 13.6% |
| Spanish Americans | 0.0 /100 | #312 | Tragic 13.6% |
| Cree | 0.0 /100 | #313 | Tragic 13.7% |
| Blacks/African Americans | 0.0 /100 | #314 | Tragic 13.7% |
| Puget Sound Salish | 0.0 /100 | #315 | Tragic 13.7% |
| Pima | 0.0 /100 | #316 | Tragic 13.7% |
| Immigrants | Cabo Verde | 0.0 /100 | #317 | Tragic 13.7% |
| Menominee | 0.0 /100 | #318 | Tragic 13.8% |