Immigrants from Jamaica vs Delaware 9th Grade
COMPARE
Immigrants from Jamaica
Delaware
9th Grade
9th Grade Comparison
Immigrants from Jamaica
Delaware
93.9%
9TH GRADE
0.4/ 100
METRIC RATING
262nd/ 347
METRIC RANK
95.6%
9TH GRADE
98.4/ 100
METRIC RATING
97th/ 347
METRIC RANK
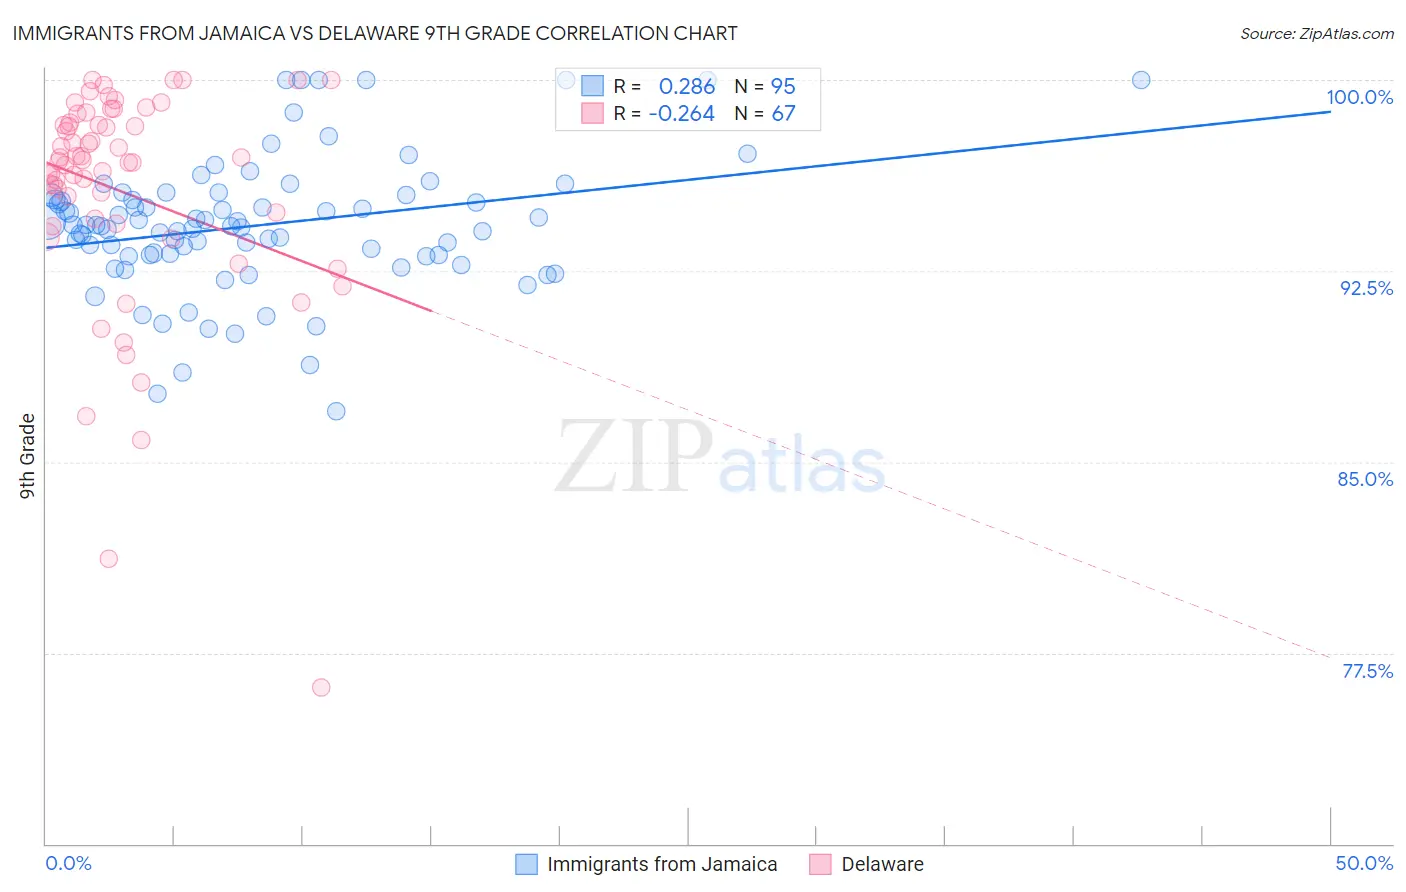
Immigrants from Jamaica vs Delaware 9th Grade Correlation Chart
The statistical analysis conducted on geographies consisting of 301,829,550 people shows a weak positive correlation between the proportion of Immigrants from Jamaica and percentage of population with at least 9th grade education in the United States with a correlation coefficient (R) of 0.286 and weighted average of 93.9%. Similarly, the statistical analysis conducted on geographies consisting of 96,234,866 people shows a weak negative correlation between the proportion of Delaware and percentage of population with at least 9th grade education in the United States with a correlation coefficient (R) of -0.264 and weighted average of 95.6%, a difference of 1.8%.
9th Grade Correlation Summary
| Measurement | Immigrants from Jamaica | Delaware |
| Minimum | 87.0% | 76.1% |
| Maximum | 100.0% | 100.0% |
| Range | 13.0% | 23.9% |
| Mean | 94.3% | 95.6% |
| Median | 94.3% | 96.8% |
| Interquartile 25% (IQ1) | 93.1% | 94.3% |
| Interquartile 75% (IQ3) | 95.5% | 98.3% |
| Interquartile Range (IQR) | 2.4% | 4.0% |
| Standard Deviation (Sample) | 2.6% | 4.5% |
| Standard Deviation (Population) | 2.6% | 4.4% |
Similar Demographics by 9th Grade
Demographics Similar to Immigrants from Jamaica by 9th Grade
In terms of 9th grade, the demographic groups most similar to Immigrants from Jamaica are Immigrants from Uzbekistan (93.9%, a difference of 0.010%), Immigrants from Congo (93.9%, a difference of 0.010%), Native/Alaskan (93.9%, a difference of 0.010%), Pima (93.9%, a difference of 0.020%), and South American (93.9%, a difference of 0.020%).
| Demographics | Rating | Rank | 9th Grade |
| Immigrants | Nigeria | 0.6 /100 | #255 | Tragic 94.0% |
| Immigrants | Afghanistan | 0.5 /100 | #256 | Tragic 94.0% |
| Immigrants | Costa Rica | 0.5 /100 | #257 | Tragic 94.0% |
| Immigrants | Thailand | 0.5 /100 | #258 | Tragic 93.9% |
| Ghanaians | 0.5 /100 | #259 | Tragic 93.9% |
| Pima | 0.4 /100 | #260 | Tragic 93.9% |
| South Americans | 0.4 /100 | #261 | Tragic 93.9% |
| Immigrants | Jamaica | 0.4 /100 | #262 | Tragic 93.9% |
| Immigrants | Uzbekistan | 0.4 /100 | #263 | Tragic 93.9% |
| Immigrants | Congo | 0.4 /100 | #264 | Tragic 93.9% |
| Natives/Alaskans | 0.4 /100 | #265 | Tragic 93.9% |
| Navajo | 0.3 /100 | #266 | Tragic 93.9% |
| Armenians | 0.3 /100 | #267 | Tragic 93.9% |
| Immigrants | Bolivia | 0.3 /100 | #268 | Tragic 93.9% |
| Immigrants | Uruguay | 0.2 /100 | #269 | Tragic 93.8% |
Demographics Similar to Delaware by 9th Grade
In terms of 9th grade, the demographic groups most similar to Delaware are Filipino (95.6%, a difference of 0.0%), American (95.6%, a difference of 0.010%), Immigrants from Japan (95.6%, a difference of 0.010%), Menominee (95.6%, a difference of 0.010%), and Immigrants from Germany (95.6%, a difference of 0.030%).
| Demographics | Rating | Rank | 9th Grade |
| South Africans | 98.8 /100 | #90 | Exceptional 95.6% |
| Creek | 98.8 /100 | #91 | Exceptional 95.6% |
| Immigrants | Saudi Arabia | 98.8 /100 | #92 | Exceptional 95.6% |
| Immigrants | Germany | 98.7 /100 | #93 | Exceptional 95.6% |
| Immigrants | Latvia | 98.7 /100 | #94 | Exceptional 95.6% |
| Americans | 98.5 /100 | #95 | Exceptional 95.6% |
| Filipinos | 98.5 /100 | #96 | Exceptional 95.6% |
| Delaware | 98.4 /100 | #97 | Exceptional 95.6% |
| Immigrants | Japan | 98.4 /100 | #98 | Exceptional 95.6% |
| Menominee | 98.3 /100 | #99 | Exceptional 95.6% |
| Lebanese | 98.1 /100 | #100 | Exceptional 95.6% |
| Immigrants | Moldova | 97.9 /100 | #101 | Exceptional 95.5% |
| Immigrants | Switzerland | 97.7 /100 | #102 | Exceptional 95.5% |
| Potawatomi | 97.7 /100 | #103 | Exceptional 95.5% |
| Syrians | 97.4 /100 | #104 | Exceptional 95.5% |