Immigrants from Iran vs Tohono O'odham Disability Age 5 to 17
COMPARE
Immigrants from Iran
Tohono O'odham
Disability Age 5 to 17
Disability Age 5 to 17 Comparison
Immigrants from Iran
Tohono O'odham
4.4%
DISABILITY AGE 5 TO 17
100.0/ 100
METRIC RATING
5th/ 347
METRIC RANK
6.5%
DISABILITY AGE 5 TO 17
0.0/ 100
METRIC RATING
321st/ 347
METRIC RANK
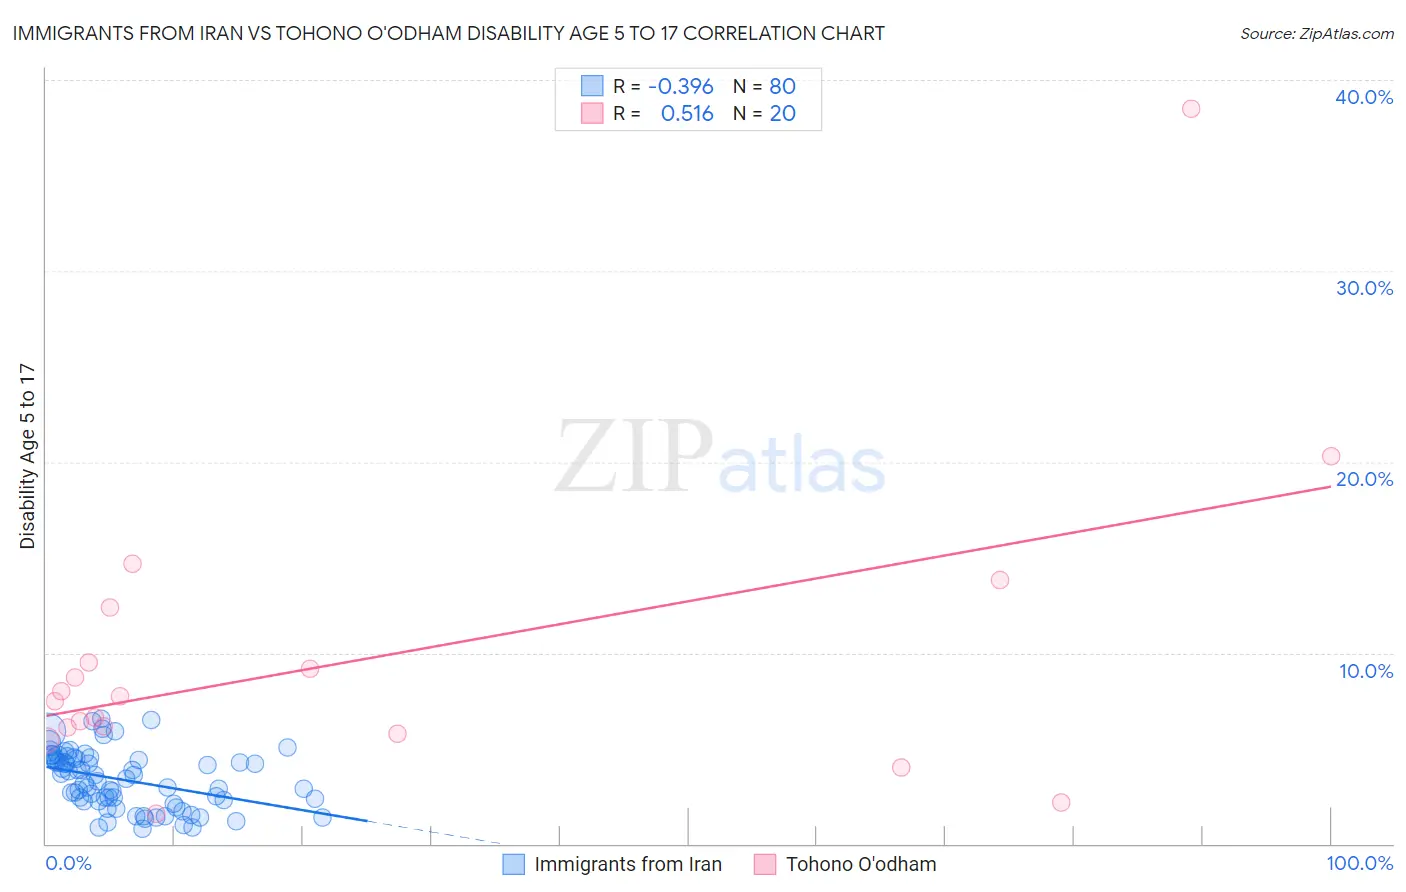
Immigrants from Iran vs Tohono O'odham Disability Age 5 to 17 Correlation Chart
The statistical analysis conducted on geographies consisting of 278,151,157 people shows a mild negative correlation between the proportion of Immigrants from Iran and percentage of population with a disability between the ages 5 and 17 in the United States with a correlation coefficient (R) of -0.396 and weighted average of 4.4%. Similarly, the statistical analysis conducted on geographies consisting of 58,652,190 people shows a substantial positive correlation between the proportion of Tohono O'odham and percentage of population with a disability between the ages 5 and 17 in the United States with a correlation coefficient (R) of 0.516 and weighted average of 6.5%, a difference of 49.4%.
Disability Age 5 to 17 Correlation Summary
| Measurement | Immigrants from Iran | Tohono O'odham |
| Minimum | 0.81% | 1.6% |
| Maximum | 6.5% | 38.5% |
| Range | 5.7% | 37.0% |
| Mean | 3.3% | 9.7% |
| Median | 3.4% | 7.6% |
| Interquartile 25% (IQ1) | 2.2% | 5.9% |
| Interquartile 75% (IQ3) | 4.4% | 10.9% |
| Interquartile Range (IQR) | 2.2% | 5.0% |
| Standard Deviation (Sample) | 1.5% | 8.1% |
| Standard Deviation (Population) | 1.5% | 7.9% |
Similar Demographics by Disability Age 5 to 17
Demographics Similar to Immigrants from Iran by Disability Age 5 to 17
In terms of disability age 5 to 17, the demographic groups most similar to Immigrants from Iran are Filipino (4.3%, a difference of 0.55%), Immigrants from Hong Kong (4.3%, a difference of 1.5%), Immigrants from Israel (4.5%, a difference of 3.4%), Immigrants from China (4.5%, a difference of 3.7%), and Immigrants from Taiwan (4.2%, a difference of 4.1%).
| Demographics | Rating | Rank | Disability Age 5 to 17 |
| Immigrants | Armenia | 100.0 /100 | #1 | Exceptional 4.1% |
| Immigrants | Taiwan | 100.0 /100 | #2 | Exceptional 4.2% |
| Immigrants | Hong Kong | 100.0 /100 | #3 | Exceptional 4.3% |
| Filipinos | 100.0 /100 | #4 | Exceptional 4.3% |
| Immigrants | Iran | 100.0 /100 | #5 | Exceptional 4.4% |
| Immigrants | Israel | 100.0 /100 | #6 | Exceptional 4.5% |
| Immigrants | China | 100.0 /100 | #7 | Exceptional 4.5% |
| Indians (Asian) | 100.0 /100 | #8 | Exceptional 4.6% |
| Immigrants | Eastern Asia | 100.0 /100 | #9 | Exceptional 4.6% |
| Immigrants | India | 100.0 /100 | #10 | Exceptional 4.6% |
| Armenians | 100.0 /100 | #11 | Exceptional 4.6% |
| Iranians | 100.0 /100 | #12 | Exceptional 4.6% |
| Thais | 100.0 /100 | #13 | Exceptional 4.7% |
| Immigrants | Korea | 100.0 /100 | #14 | Exceptional 4.7% |
| Chinese | 100.0 /100 | #15 | Exceptional 4.7% |
Demographics Similar to Tohono O'odham by Disability Age 5 to 17
In terms of disability age 5 to 17, the demographic groups most similar to Tohono O'odham are Slovak (6.5%, a difference of 0.020%), Osage (6.5%, a difference of 0.060%), Dominican (6.5%, a difference of 0.14%), American (6.5%, a difference of 0.19%), and Potawatomi (6.5%, a difference of 0.32%).
| Demographics | Rating | Rank | Disability Age 5 to 17 |
| French | 0.0 /100 | #314 | Tragic 6.4% |
| Immigrants | Portugal | 0.0 /100 | #315 | Tragic 6.4% |
| Immigrants | Dominican Republic | 0.0 /100 | #316 | Tragic 6.4% |
| Kiowa | 0.0 /100 | #317 | Tragic 6.4% |
| Comanche | 0.0 /100 | #318 | Tragic 6.4% |
| Delaware | 0.0 /100 | #319 | Tragic 6.5% |
| Africans | 0.0 /100 | #320 | Tragic 6.5% |
| Tohono O'odham | 0.0 /100 | #321 | Tragic 6.5% |
| Slovaks | 0.0 /100 | #322 | Tragic 6.5% |
| Osage | 0.0 /100 | #323 | Tragic 6.5% |
| Dominicans | 0.0 /100 | #324 | Tragic 6.5% |
| Americans | 0.0 /100 | #325 | Tragic 6.5% |
| Potawatomi | 0.0 /100 | #326 | Tragic 6.5% |
| French American Indians | 0.0 /100 | #327 | Tragic 6.6% |
| Pennsylvania Germans | 0.0 /100 | #328 | Tragic 6.6% |