Immigrants from Iran vs Tohono O'odham Unemployment Among Ages 65 to 74 years
COMPARE
Immigrants from Iran
Tohono O'odham
Unemployment Among Ages 65 to 74 years
Unemployment Among Ages 65 to 74 years Comparison
Immigrants from Iran
Tohono O'odham
5.4%
UNEMPLOYMENT AMONG AGES 65 TO 74 YEARS
49.0/ 100
METRIC RATING
175th/ 347
METRIC RANK
6.0%
UNEMPLOYMENT AMONG AGES 65 TO 74 YEARS
0.0/ 100
METRIC RATING
324th/ 347
METRIC RANK
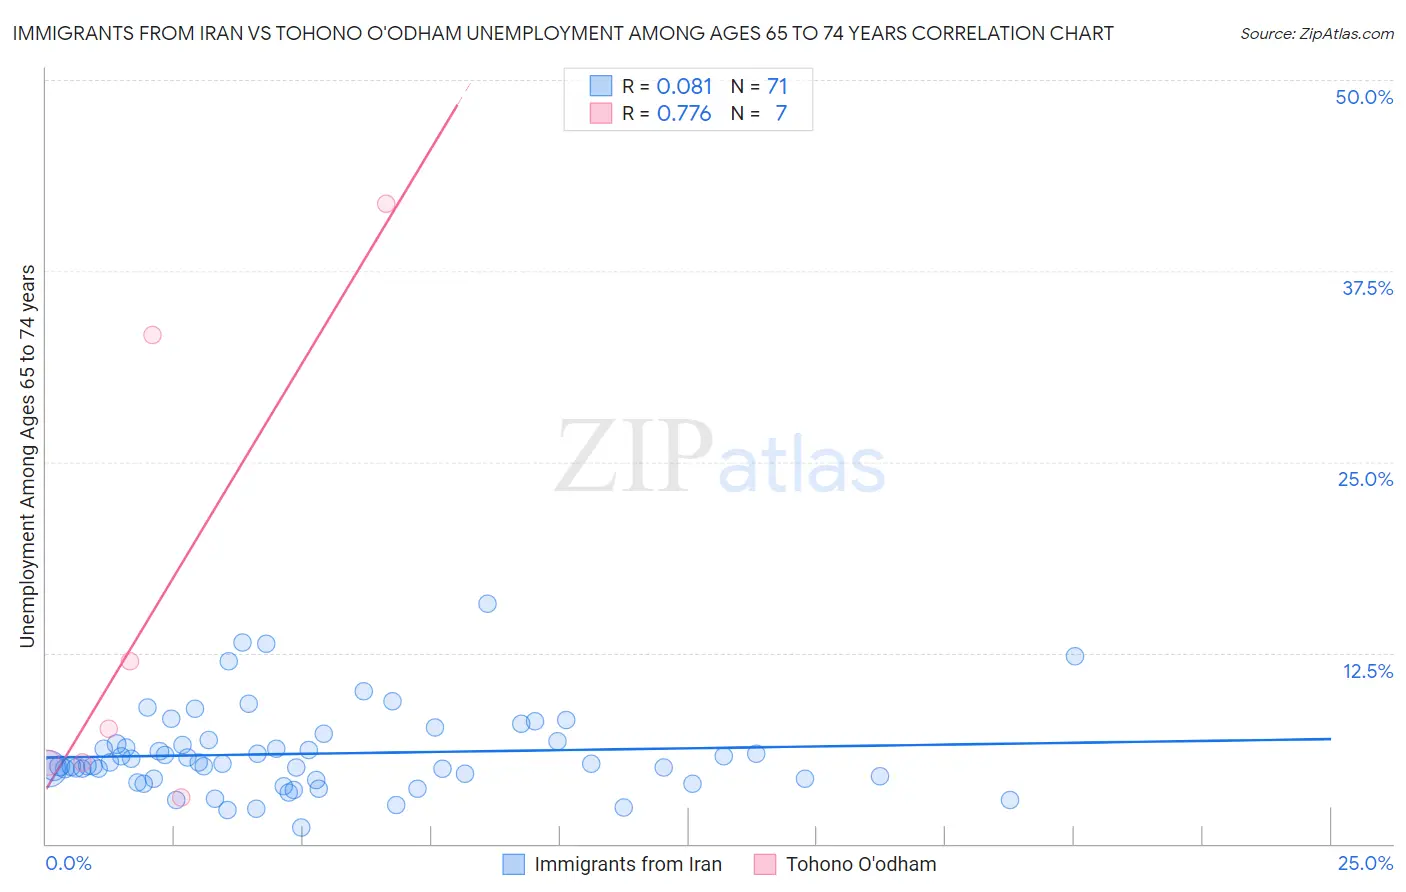
Immigrants from Iran vs Tohono O'odham Unemployment Among Ages 65 to 74 years Correlation Chart
The statistical analysis conducted on geographies consisting of 259,750,202 people shows a slight positive correlation between the proportion of Immigrants from Iran and unemployment rate among population between the ages 65 and 74 in the United States with a correlation coefficient (R) of 0.081 and weighted average of 5.4%. Similarly, the statistical analysis conducted on geographies consisting of 57,258,551 people shows a strong positive correlation between the proportion of Tohono O'odham and unemployment rate among population between the ages 65 and 74 in the United States with a correlation coefficient (R) of 0.776 and weighted average of 6.0%, a difference of 12.1%.
Unemployment Among Ages 65 to 74 years Correlation Summary
| Measurement | Immigrants from Iran | Tohono O'odham |
| Minimum | 1.1% | 3.0% |
| Maximum | 15.7% | 41.9% |
| Range | 14.6% | 38.9% |
| Mean | 5.9% | 15.5% |
| Median | 5.2% | 7.6% |
| Interquartile 25% (IQ1) | 4.3% | 5.3% |
| Interquartile 75% (IQ3) | 6.7% | 33.3% |
| Interquartile Range (IQR) | 2.4% | 28.0% |
| Standard Deviation (Sample) | 2.7% | 15.6% |
| Standard Deviation (Population) | 2.7% | 14.4% |
Similar Demographics by Unemployment Among Ages 65 to 74 years
Demographics Similar to Immigrants from Iran by Unemployment Among Ages 65 to 74 years
In terms of unemployment among ages 65 to 74 years, the demographic groups most similar to Immigrants from Iran are Potawatomi (5.4%, a difference of 0.030%), Immigrants from Western Europe (5.4%, a difference of 0.060%), Greek (5.4%, a difference of 0.070%), Immigrants from Northern Europe (5.4%, a difference of 0.070%), and Arab (5.4%, a difference of 0.070%).
| Demographics | Rating | Rank | Unemployment Among Ages 65 to 74 years |
| Whites/Caucasians | 57.2 /100 | #168 | Average 5.4% |
| Laotians | 55.7 /100 | #169 | Average 5.4% |
| Syrians | 53.7 /100 | #170 | Average 5.4% |
| Panamanians | 51.8 /100 | #171 | Average 5.4% |
| Greeks | 51.1 /100 | #172 | Average 5.4% |
| Immigrants | Northern Europe | 51.1 /100 | #173 | Average 5.4% |
| Potawatomi | 50.0 /100 | #174 | Average 5.4% |
| Immigrants | Iran | 49.0 /100 | #175 | Average 5.4% |
| Immigrants | Western Europe | 47.3 /100 | #176 | Average 5.4% |
| Arabs | 46.8 /100 | #177 | Average 5.4% |
| French | 43.1 /100 | #178 | Average 5.4% |
| Guamanians/Chamorros | 42.1 /100 | #179 | Average 5.4% |
| Immigrants | Ireland | 42.0 /100 | #180 | Average 5.4% |
| Soviet Union | 40.0 /100 | #181 | Fair 5.4% |
| Spanish Americans | 38.2 /100 | #182 | Fair 5.4% |
Demographics Similar to Tohono O'odham by Unemployment Among Ages 65 to 74 years
In terms of unemployment among ages 65 to 74 years, the demographic groups most similar to Tohono O'odham are Immigrants from Portugal (6.0%, a difference of 0.12%), Native/Alaskan (6.0%, a difference of 0.36%), Delaware (6.0%, a difference of 0.58%), Immigrants from Mexico (6.0%, a difference of 0.63%), and Immigrants from Dominica (6.0%, a difference of 0.85%).
| Demographics | Rating | Rank | Unemployment Among Ages 65 to 74 years |
| Immigrants | Central America | 0.0 /100 | #317 | Tragic 5.9% |
| Zimbabweans | 0.0 /100 | #318 | Tragic 5.9% |
| Aleuts | 0.0 /100 | #319 | Tragic 5.9% |
| Immigrants | Bahamas | 0.0 /100 | #320 | Tragic 5.9% |
| Immigrants | Dominica | 0.0 /100 | #321 | Tragic 6.0% |
| Immigrants | Mexico | 0.0 /100 | #322 | Tragic 6.0% |
| Delaware | 0.0 /100 | #323 | Tragic 6.0% |
| Tohono O'odham | 0.0 /100 | #324 | Tragic 6.0% |
| Immigrants | Portugal | 0.0 /100 | #325 | Tragic 6.0% |
| Natives/Alaskans | 0.0 /100 | #326 | Tragic 6.0% |
| Shoshone | 0.0 /100 | #327 | Tragic 6.2% |
| Immigrants | Azores | 0.0 /100 | #328 | Tragic 6.2% |
| Yuman | 0.0 /100 | #329 | Tragic 6.2% |
| Dominicans | 0.0 /100 | #330 | Tragic 6.3% |
| Bermudans | 0.0 /100 | #331 | Tragic 6.3% |