Immigrants from Iran vs Immigrants from Venezuela Disability Age 5 to 17
COMPARE
Immigrants from Iran
Immigrants from Venezuela
Disability Age 5 to 17
Disability Age 5 to 17 Comparison
Immigrants from Iran
Immigrants from Venezuela
4.4%
DISABILITY AGE 5 TO 17
100.0/ 100
METRIC RATING
5th/ 347
METRIC RANK
5.4%
DISABILITY AGE 5 TO 17
94.5/ 100
METRIC RATING
128th/ 347
METRIC RANK
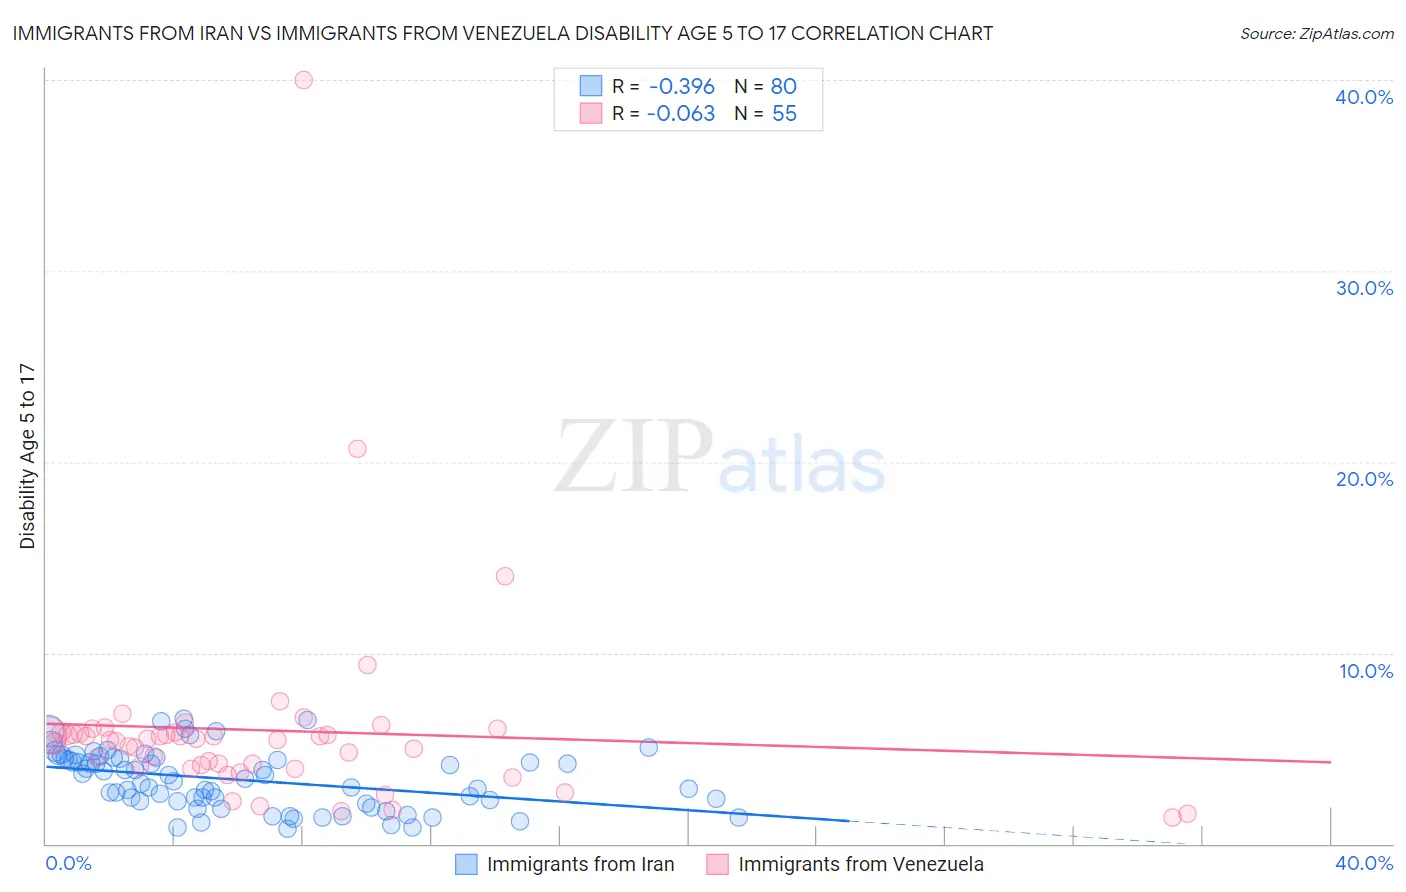
Immigrants from Iran vs Immigrants from Venezuela Disability Age 5 to 17 Correlation Chart
The statistical analysis conducted on geographies consisting of 278,151,157 people shows a mild negative correlation between the proportion of Immigrants from Iran and percentage of population with a disability between the ages 5 and 17 in the United States with a correlation coefficient (R) of -0.396 and weighted average of 4.4%. Similarly, the statistical analysis conducted on geographies consisting of 286,570,135 people shows a slight negative correlation between the proportion of Immigrants from Venezuela and percentage of population with a disability between the ages 5 and 17 in the United States with a correlation coefficient (R) of -0.063 and weighted average of 5.4%, a difference of 23.9%.
Disability Age 5 to 17 Correlation Summary
| Measurement | Immigrants from Iran | Immigrants from Venezuela |
| Minimum | 0.81% | 1.4% |
| Maximum | 6.5% | 40.0% |
| Range | 5.7% | 38.6% |
| Mean | 3.3% | 5.9% |
| Median | 3.4% | 5.5% |
| Interquartile 25% (IQ1) | 2.2% | 4.1% |
| Interquartile 75% (IQ3) | 4.4% | 5.8% |
| Interquartile Range (IQR) | 2.2% | 1.8% |
| Standard Deviation (Sample) | 1.5% | 5.5% |
| Standard Deviation (Population) | 1.5% | 5.5% |
Similar Demographics by Disability Age 5 to 17
Demographics Similar to Immigrants from Iran by Disability Age 5 to 17
In terms of disability age 5 to 17, the demographic groups most similar to Immigrants from Iran are Filipino (4.3%, a difference of 0.55%), Immigrants from Hong Kong (4.3%, a difference of 1.5%), Immigrants from Israel (4.5%, a difference of 3.4%), Immigrants from China (4.5%, a difference of 3.7%), and Immigrants from Taiwan (4.2%, a difference of 4.1%).
| Demographics | Rating | Rank | Disability Age 5 to 17 |
| Immigrants | Armenia | 100.0 /100 | #1 | Exceptional 4.1% |
| Immigrants | Taiwan | 100.0 /100 | #2 | Exceptional 4.2% |
| Immigrants | Hong Kong | 100.0 /100 | #3 | Exceptional 4.3% |
| Filipinos | 100.0 /100 | #4 | Exceptional 4.3% |
| Immigrants | Iran | 100.0 /100 | #5 | Exceptional 4.4% |
| Immigrants | Israel | 100.0 /100 | #6 | Exceptional 4.5% |
| Immigrants | China | 100.0 /100 | #7 | Exceptional 4.5% |
| Indians (Asian) | 100.0 /100 | #8 | Exceptional 4.6% |
| Immigrants | Eastern Asia | 100.0 /100 | #9 | Exceptional 4.6% |
| Immigrants | India | 100.0 /100 | #10 | Exceptional 4.6% |
| Armenians | 100.0 /100 | #11 | Exceptional 4.6% |
| Iranians | 100.0 /100 | #12 | Exceptional 4.6% |
| Thais | 100.0 /100 | #13 | Exceptional 4.7% |
| Immigrants | Korea | 100.0 /100 | #14 | Exceptional 4.7% |
| Chinese | 100.0 /100 | #15 | Exceptional 4.7% |
Demographics Similar to Immigrants from Venezuela by Disability Age 5 to 17
In terms of disability age 5 to 17, the demographic groups most similar to Immigrants from Venezuela are Romanian (5.4%, a difference of 0.090%), Latvian (5.4%, a difference of 0.11%), Immigrants from Bulgaria (5.4%, a difference of 0.11%), New Zealander (5.4%, a difference of 0.12%), and Immigrants from Chile (5.4%, a difference of 0.13%).
| Demographics | Rating | Rank | Disability Age 5 to 17 |
| Maltese | 96.0 /100 | #121 | Exceptional 5.4% |
| Chileans | 95.8 /100 | #122 | Exceptional 5.4% |
| Immigrants | Ethiopia | 95.5 /100 | #123 | Exceptional 5.4% |
| Crow | 95.0 /100 | #124 | Exceptional 5.4% |
| Immigrants | Chile | 95.0 /100 | #125 | Exceptional 5.4% |
| New Zealanders | 95.0 /100 | #126 | Exceptional 5.4% |
| Latvians | 95.0 /100 | #127 | Exceptional 5.4% |
| Immigrants | Venezuela | 94.5 /100 | #128 | Exceptional 5.4% |
| Romanians | 94.1 /100 | #129 | Exceptional 5.4% |
| Immigrants | Bulgaria | 94.0 /100 | #130 | Exceptional 5.4% |
| Arabs | 92.9 /100 | #131 | Exceptional 5.4% |
| Immigrants | Colombia | 92.9 /100 | #132 | Exceptional 5.4% |
| Venezuelans | 92.7 /100 | #133 | Exceptional 5.4% |
| Yuman | 92.3 /100 | #134 | Exceptional 5.4% |
| Immigrants | Belize | 91.7 /100 | #135 | Exceptional 5.4% |