Immigrants from Indonesia vs Cree Male Disability
COMPARE
Immigrants from Indonesia
Cree
Male Disability
Male Disability Comparison
Immigrants from Indonesia
Cree
10.2%
MALE DISABILITY
99.8/ 100
METRIC RATING
37th/ 347
METRIC RANK
13.7%
MALE DISABILITY
0.0/ 100
METRIC RATING
318th/ 347
METRIC RANK
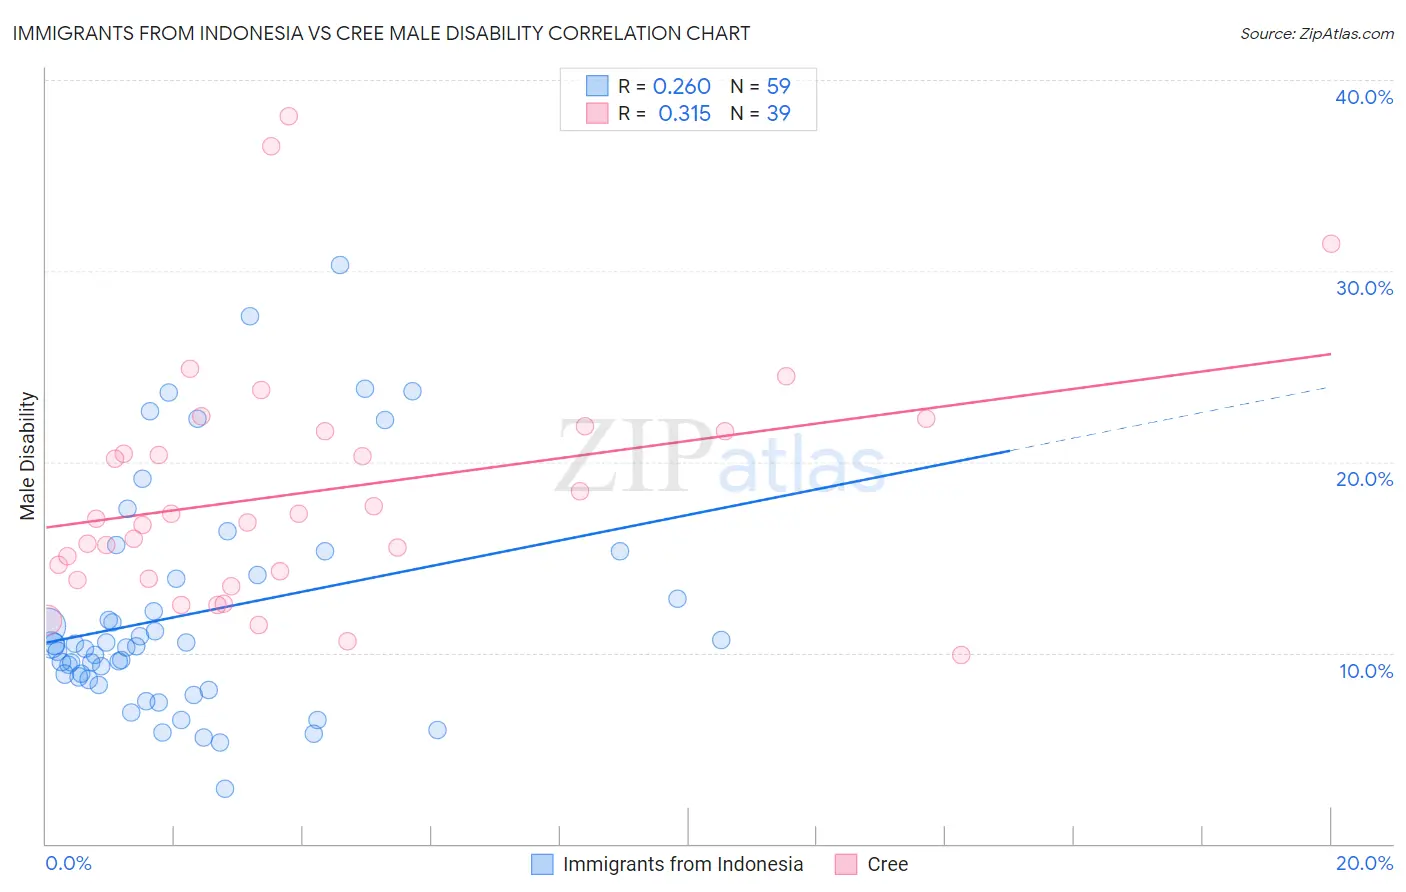
Immigrants from Indonesia vs Cree Male Disability Correlation Chart
The statistical analysis conducted on geographies consisting of 215,790,379 people shows a weak positive correlation between the proportion of Immigrants from Indonesia and percentage of males with a disability in the United States with a correlation coefficient (R) of 0.260 and weighted average of 10.2%. Similarly, the statistical analysis conducted on geographies consisting of 76,208,606 people shows a mild positive correlation between the proportion of Cree and percentage of males with a disability in the United States with a correlation coefficient (R) of 0.315 and weighted average of 13.7%, a difference of 34.3%.
Male Disability Correlation Summary
| Measurement | Immigrants from Indonesia | Cree |
| Minimum | 2.9% | 9.9% |
| Maximum | 30.3% | 38.1% |
| Range | 27.4% | 28.2% |
| Mean | 12.0% | 18.5% |
| Median | 10.4% | 17.0% |
| Interquartile 25% (IQ1) | 8.6% | 13.9% |
| Interquartile 75% (IQ3) | 14.0% | 21.6% |
| Interquartile Range (IQR) | 5.4% | 7.7% |
| Standard Deviation (Sample) | 5.9% | 6.4% |
| Standard Deviation (Population) | 5.9% | 6.3% |
Similar Demographics by Male Disability
Demographics Similar to Immigrants from Indonesia by Male Disability
In terms of male disability, the demographic groups most similar to Immigrants from Indonesia are Ethiopian (10.2%, a difference of 0.070%), Immigrants from Argentina (10.2%, a difference of 0.12%), Immigrants from Kuwait (10.2%, a difference of 0.17%), Immigrants from Turkey (10.2%, a difference of 0.24%), and Immigrants from Ethiopia (10.2%, a difference of 0.30%).
| Demographics | Rating | Rank | Male Disability |
| Immigrants | Egypt | 99.9 /100 | #30 | Exceptional 10.1% |
| Soviet Union | 99.9 /100 | #31 | Exceptional 10.1% |
| Argentineans | 99.9 /100 | #32 | Exceptional 10.1% |
| Immigrants | Ethiopia | 99.9 /100 | #33 | Exceptional 10.2% |
| Immigrants | Turkey | 99.9 /100 | #34 | Exceptional 10.2% |
| Immigrants | Argentina | 99.9 /100 | #35 | Exceptional 10.2% |
| Ethiopians | 99.8 /100 | #36 | Exceptional 10.2% |
| Immigrants | Indonesia | 99.8 /100 | #37 | Exceptional 10.2% |
| Immigrants | Kuwait | 99.8 /100 | #38 | Exceptional 10.2% |
| Afghans | 99.8 /100 | #39 | Exceptional 10.2% |
| Immigrants | Nepal | 99.8 /100 | #40 | Exceptional 10.3% |
| Taiwanese | 99.8 /100 | #41 | Exceptional 10.3% |
| Mongolians | 99.7 /100 | #42 | Exceptional 10.3% |
| Immigrants | Bangladesh | 99.7 /100 | #43 | Exceptional 10.3% |
| Immigrants | El Salvador | 99.7 /100 | #44 | Exceptional 10.3% |
Demographics Similar to Cree by Male Disability
In terms of male disability, the demographic groups most similar to Cree are Paiute (13.7%, a difference of 0.21%), American (13.8%, a difference of 0.41%), Tlingit-Haida (13.8%, a difference of 0.90%), Shoshone (13.8%, a difference of 0.96%), and Alaska Native (13.6%, a difference of 1.0%).
| Demographics | Rating | Rank | Male Disability |
| Delaware | 0.0 /100 | #311 | Tragic 13.5% |
| Yakama | 0.0 /100 | #312 | Tragic 13.5% |
| Puget Sound Salish | 0.0 /100 | #313 | Tragic 13.5% |
| Aleuts | 0.0 /100 | #314 | Tragic 13.5% |
| Iroquois | 0.0 /100 | #315 | Tragic 13.6% |
| Alaska Natives | 0.0 /100 | #316 | Tragic 13.6% |
| Paiute | 0.0 /100 | #317 | Tragic 13.7% |
| Cree | 0.0 /100 | #318 | Tragic 13.7% |
| Americans | 0.0 /100 | #319 | Tragic 13.8% |
| Tlingit-Haida | 0.0 /100 | #320 | Tragic 13.8% |
| Shoshone | 0.0 /100 | #321 | Tragic 13.8% |
| Apache | 0.0 /100 | #322 | Tragic 14.0% |
| Osage | 0.0 /100 | #323 | Tragic 14.0% |
| Comanche | 0.0 /100 | #324 | Tragic 14.1% |
| Ottawa | 0.0 /100 | #325 | Tragic 14.1% |