Immigrants from Indonesia vs Moroccan Male Disability

COMPARE

Immigrants from Indonesia
Race
Ancestry
AfghanAfricanAlaska NativeAlaskan AthabascanAlbanianAleutAlsatianAmericanApacheArabArapahoArgentineanArmenianAssyrian/Chaldean/SyriacAustralianAustrianBahamianBangladeshiBarbadianBasqueBelgianBelizeanBermudanBhutaneseBlackfeetBolivianBrazilianBritishBritish West IndianBulgarianBurmeseCajunCambodianCanadianCape VerdeanCarpatho RusynCelticCentral AmericanCentral American IndianCherokeeCheyenneChickasawChileanChineseChippewaChoctawColombianColvilleComancheCosta RicanCreeCreekCroatianCrowCubanCypriotCzechCzechoslovakianDanishDelawareDominicanDutchDutch West IndianEastern EuropeanEcuadorianEgyptianEnglishEstonianEthiopianEuropeanFijianFilipinoFinnishFrenchFrench American IndianFrench CanadianGermanGerman RussianGhanaianGreekGuamanian/ChamorroGuatemalanGuyaneseHaitianHmongHonduranHopiHoumaHungarianIcelanderIndian (Asian)IndonesianInupiatIranianIraqiIrishIroquoisIsraeliItalianJamaicanJapaneseJordanianKenyanKiowaKoreanLaotianLatvianLebaneseLiberianLithuanianLumbeeLuxembourgerMacedonianMalaysianMalteseMarshalleseMenomineeMexicanMexican American IndianMongolianNative HawaiianNavajoNepaleseNew ZealanderNicaraguanNigerianNorthern EuropeanNorwegianOkinawanOsageOttawaPaiutePakistaniPalestinianPanamanianParaguayanPennsylvania GermanPeruvianPimaPolishPortuguesePotawatomiPuebloPuerto RicanPuget Sound SalishRomanianRussianSalvadoranSamoanScandinavianScotch-IrishScottishSeminoleSenegaleseSerbianShoshoneSierra LeoneanSiouxSlavicSlovakSloveneSomaliSouth AfricanSouth AmericanSouth American IndianSoviet UnionSpaniardSpanishSpanish AmericanSpanish American IndianSri LankanSubsaharan AfricanSudaneseSwedishSwissSyrianTaiwaneseThaiTlingit-HaidaTohono O'OdhamTonganTrinidadian and TobagonianTsimshianTurkishU.S. Virgin IslanderUgandanUkrainianUruguayanUteVenezuelanVietnameseWelshWest IndianYakamaYaquiYugoslavianYumanYup'ikZimbabwean
Immigration
NonimmigrantsImmigrantsAfghanistanAfricaAlbaniaArgentinaArmeniaAsiaAustraliaAustriaBahamasBangladeshBarbadosBelarusBelgiumBelizeBoliviaBosnia and HerzegovinaBrazilBulgariaBurma/MyanmarCabo VerdeCambodiaCameroonCanadaCaribbeanCentral AmericaChileChinaColombiaCongoCosta RicaCroatiaCubaCzechoslovakiaDenmarkDominicaDominican RepublicEastern AfricaEastern AsiaEastern EuropeEcuadorEgyptEl SalvadorEnglandEritreaEthiopiaEuropeFijiFranceGermanyGhanaGreeceGrenadaGuatemalaGuyanaHaitiHondurasHong KongHungaryIndiaIndonesiaIranIraqIrelandIsraelItalyJamaicaJapanJordanKazakhstanKenyaKoreaKuwaitLaosLatin AmericaLatviaLebanonLiberiaLithuaniaMalaysiaMexicoMicronesiaMiddle AfricaMoldovaMoroccoNepalNetherlandsNicaraguaNigeriaNorth AmericaNorth MacedoniaNorthern AfricaNorthern EuropeNorwayOceaniaPakistanPanamaPeruPhilippinesPolandPortugalRomaniaRussiaSaudi ArabiaScotlandSenegalSerbiaSierra LeoneSingaporeSomaliaSouth AfricaSouth AmericaSouth Central AsiaSouth Eastern AsiaSouthern EuropeSpainSri LankaSt. Vincent and the GrenadinesSudanSwedenSwitzerlandSyriaTaiwanThailandTrinidad and TobagoTurkeyUgandaUkraineUruguayUzbekistanVenezuelaVietnamWest IndiesWestern AfricaWestern AsiaWestern EuropeYemenZaireZimbabweAzores
Moroccan
Race
Ancestry
AfghanAfricanAlaska NativeAlaskan AthabascanAlbanianAleutAlsatianAmericanApacheArabArapahoArgentineanArmenianAssyrian/Chaldean/SyriacAustralianAustrianBahamianBangladeshiBarbadianBasqueBelgianBelizeanBermudanBhutaneseBlackfeetBolivianBrazilianBritishBritish West IndianBulgarianBurmeseCajunCambodianCanadianCape VerdeanCarpatho RusynCelticCentral AmericanCentral American IndianCherokeeCheyenneChickasawChileanChineseChippewaChoctawColombianColvilleComancheCosta RicanCreeCreekCroatianCrowCubanCypriotCzechCzechoslovakianDanishDelawareDominicanDutchDutch West IndianEastern EuropeanEcuadorianEgyptianEnglishEstonianEthiopianEuropeanFijianFilipinoFinnishFrenchFrench American IndianFrench CanadianGermanGerman RussianGhanaianGreekGuamanian/ChamorroGuatemalanGuyaneseHaitianHmongHonduranHopiHoumaHungarianIcelanderIndian (Asian)IndonesianInupiatIranianIraqiIrishIroquoisIsraeliItalianJamaicanJapaneseJordanianKenyanKiowaKoreanLaotianLatvianLebaneseLiberianLithuanianLumbeeLuxembourgerMacedonianMalaysianMalteseMarshalleseMenomineeMexicanMexican American IndianMongolianMoroccanNative HawaiianNavajoNepaleseNew ZealanderNicaraguanNigerianNorthern EuropeanNorwegianOkinawanOsageOttawaPaiutePakistaniPalestinianPanamanianParaguayanPennsylvania GermanPeruvianPimaPolishPortuguesePotawatomiPuebloPuerto RicanPuget Sound SalishRomanianRussianSalvadoranSamoanScandinavianScotch-IrishScottishSeminoleSenegaleseSerbianShoshoneSierra LeoneanSiouxSlavicSlovakSloveneSomaliSouth AfricanSouth AmericanSouth American IndianSoviet UnionSpaniardSpanishSpanish AmericanSpanish American IndianSri LankanSubsaharan AfricanSudaneseSwedishSwissSyrianTaiwaneseThaiTlingit-HaidaTohono O'OdhamTonganTrinidadian and TobagonianTsimshianTurkishU.S. Virgin IslanderUgandanUkrainianUruguayanUteVenezuelanVietnameseWelshWest IndianYakamaYaquiYugoslavianYumanYup'ikZimbabwean
Immigration
NonimmigrantsImmigrantsAfghanistanAfricaAlbaniaArgentinaArmeniaAsiaAustraliaAustriaBahamasBangladeshBarbadosBelarusBelgiumBelizeBoliviaBosnia and HerzegovinaBrazilBulgariaBurma/MyanmarCabo VerdeCambodiaCameroonCanadaCaribbeanCentral AmericaChileChinaColombiaCongoCosta RicaCroatiaCubaCzechoslovakiaDenmarkDominicaDominican RepublicEastern AfricaEastern AsiaEastern EuropeEcuadorEgyptEl SalvadorEnglandEritreaEthiopiaEuropeFijiFranceGermanyGhanaGreeceGrenadaGuatemalaGuyanaHaitiHondurasHong KongHungaryIndiaIranIraqIrelandIsraelItalyJamaicaJapanJordanKazakhstanKenyaKoreaKuwaitLaosLatin AmericaLatviaLebanonLiberiaLithuaniaMalaysiaMexicoMicronesiaMiddle AfricaMoldovaMoroccoNepalNetherlandsNicaraguaNigeriaNorth AmericaNorth MacedoniaNorthern AfricaNorthern EuropeNorwayOceaniaPakistanPanamaPeruPhilippinesPolandPortugalRomaniaRussiaSaudi ArabiaScotlandSenegalSerbiaSierra LeoneSingaporeSomaliaSouth AfricaSouth AmericaSouth Central AsiaSouth Eastern AsiaSouthern EuropeSpainSri LankaSt. Vincent and the GrenadinesSudanSwedenSwitzerlandSyriaTaiwanThailandTrinidad and TobagoTurkeyUgandaUkraineUruguayUzbekistanVenezuelaVietnamWest IndiesWestern AfricaWestern AsiaWestern EuropeYemenZaireZimbabweAzores
Male Disability
Income
Poverty
Unemployment
Labor Participation
Family Structure
Vehicle Availability
Education Level
Disability

Male Disability Comparison

Immigrants from Indonesia

Moroccans

Exceptional
Excellent
10.2%
MALE DISABILITY
99.8/ 100
METRIC RATING
37th/ 347
METRIC RANK
11.0%
MALE DISABILITY
80.7/ 100
METRIC RATING
143rd/ 347
METRIC RANK

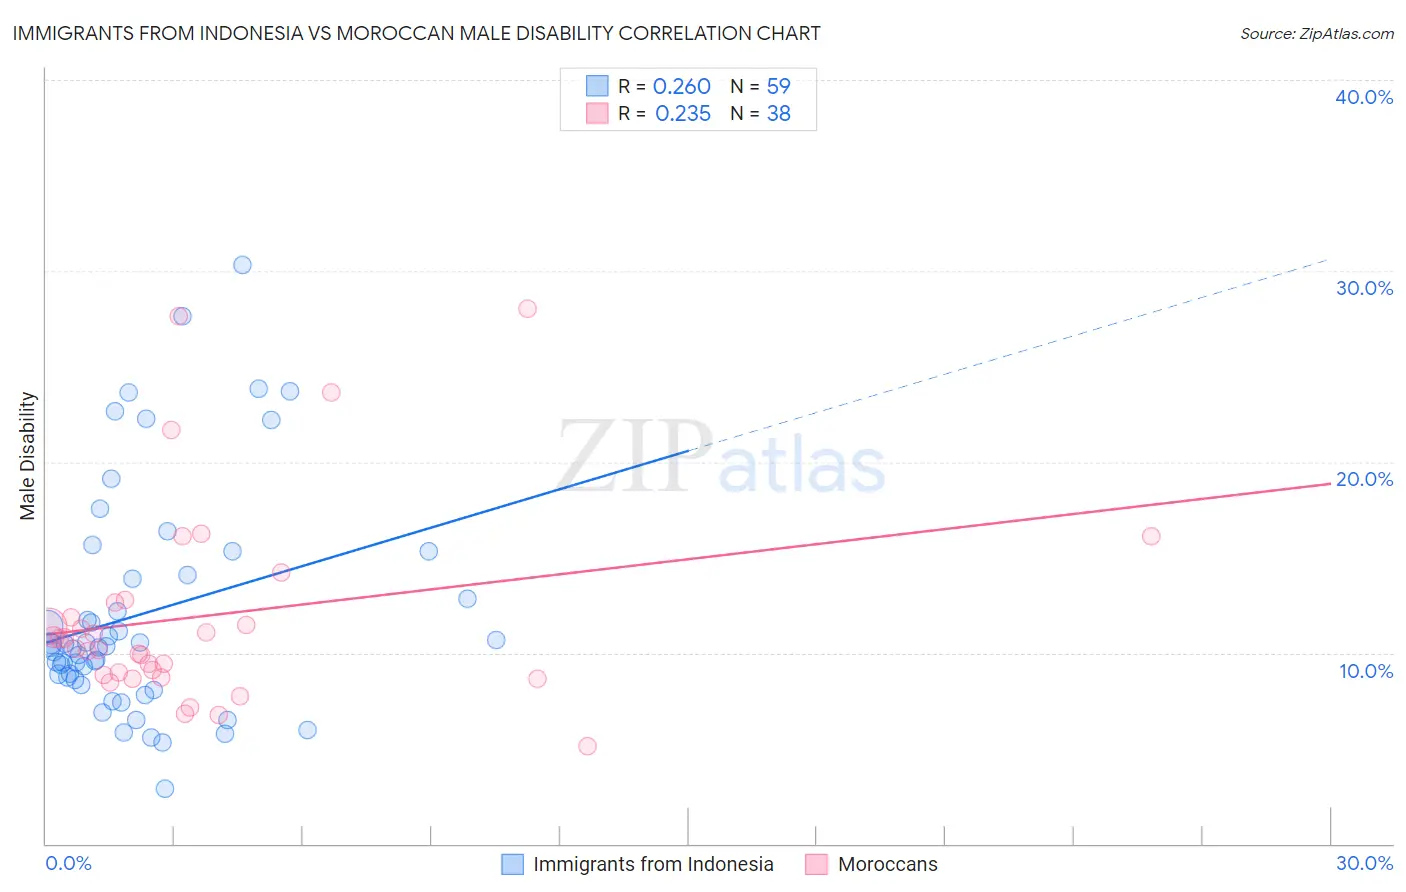
Immigrants from Indonesia vs Moroccan Male Disability Correlation Chart

The statistical analysis conducted on geographies consisting of 215,790,379 people shows a weak positive correlation between the proportion of Immigrants from Indonesia and percentage of males with a disability in the United States with a correlation coefficient (R) of 0.260 and weighted average of 10.2%. Similarly, the statistical analysis conducted on geographies consisting of 201,806,730 people shows a weak positive correlation between the proportion of Moroccans and percentage of males with a disability in the United States with a correlation coefficient (R) of 0.235 and weighted average of 11.0%, a difference of 7.6%.
Immigrants from Indonesia vs Moroccan Male Disability

Male Disability Correlation Summary

MeasurementImmigrants from IndonesiaMoroccan
Minimum2.9%5.1%
Maximum30.3%28.0%
Range27.4%22.9%
Mean12.0%11.9%
Median10.4%10.5%
Interquartile 25% (IQ1)8.6%8.8%
Interquartile 75% (IQ3)14.0%12.6%
Interquartile Range (IQR)5.4%3.8%
Standard Deviation (Sample)5.9%5.3%
Standard Deviation (Population)5.9%5.2%

Similar Demographics by Male Disability

Demographics Similar to Immigrants from Indonesia by Male Disability

In terms of male disability, the demographic groups most similar to Immigrants from Indonesia are Ethiopian (10.2%, a difference of 0.070%), Immigrants from Argentina (10.2%, a difference of 0.12%), Immigrants from Kuwait (10.2%, a difference of 0.17%), Immigrants from Turkey (10.2%, a difference of 0.24%), and Immigrants from Ethiopia (10.2%, a difference of 0.30%).
DemographicsRating | RankMale Disability
Immigrants | Egypt
99.9
/100
|
#30
Exceptional
10.1%
Soviet Union
99.9
/100
|
#31
Exceptional
10.1%
Argentineans
99.9
/100
|
#32
Exceptional
10.1%
Immigrants | Ethiopia
99.9
/100
|
#33
Exceptional
10.2%
Immigrants | Turkey
99.9
/100
|
#34
Exceptional
10.2%
Immigrants | Argentina
99.9
/100
|
#35
Exceptional
10.2%
Ethiopians
99.8
/100
|
#36
Exceptional
10.2%
Immigrants | Indonesia
99.8
/100
|
#37
Exceptional
10.2%
Immigrants | Kuwait
99.8
/100
|
#38
Exceptional
10.2%
Afghans
99.8
/100
|
#39
Exceptional
10.2%
Immigrants | Nepal
99.8
/100
|
#40
Exceptional
10.3%
Taiwanese
99.8
/100
|
#41
Exceptional
10.3%
Mongolians
99.7
/100
|
#42
Exceptional
10.3%
Immigrants | Bangladesh
99.7
/100
|
#43
Exceptional
10.3%
Immigrants | El Salvador
99.7
/100
|
#44
Exceptional
10.3%

Demographics Similar to Moroccans by Male Disability

In terms of male disability, the demographic groups most similar to Moroccans are Immigrants from Italy (11.0%, a difference of 0.070%), Arab (11.0%, a difference of 0.070%), Immigrants from Sudan (11.0%, a difference of 0.070%), South African (11.0%, a difference of 0.090%), and Nigerian (11.0%, a difference of 0.11%).
DemographicsRating | RankMale Disability
Immigrants | Costa Rica
82.8
/100
|
#136
Excellent
11.0%
Immigrants | Europe
82.0
/100
|
#137
Excellent
11.0%
Nigerians
81.9
/100
|
#138
Excellent
11.0%
South Africans
81.7
/100
|
#139
Excellent
11.0%
Immigrants | Italy
81.5
/100
|
#140
Excellent
11.0%
Arabs
81.5
/100
|
#141
Excellent
11.0%
Immigrants | Sudan
81.5
/100
|
#142
Excellent
11.0%
Moroccans
80.7
/100
|
#143
Excellent
11.0%
Kenyans
78.1
/100
|
#144
Good
11.0%
Costa Ricans
78.0
/100
|
#145
Good
11.0%
Koreans
77.5
/100
|
#146
Good
11.0%
Immigrants | Croatia
77.3
/100
|
#147
Good
11.0%
Sudanese
77.1
/100
|
#148
Good
11.0%
Immigrants | Denmark
76.4
/100
|
#149
Good
11.0%
Immigrants | Guatemala
75.1
/100
|
#150
Good
11.0%