Immigrants from Indonesia vs Immigrants from Mexico Male Disability
COMPARE
Immigrants from Indonesia
Immigrants from Mexico
Male Disability
Male Disability Comparison
Immigrants from Indonesia
Immigrants from Mexico
10.2%
MALE DISABILITY
99.8/ 100
METRIC RATING
37th/ 347
METRIC RANK
11.5%
MALE DISABILITY
12.6/ 100
METRIC RATING
202nd/ 347
METRIC RANK
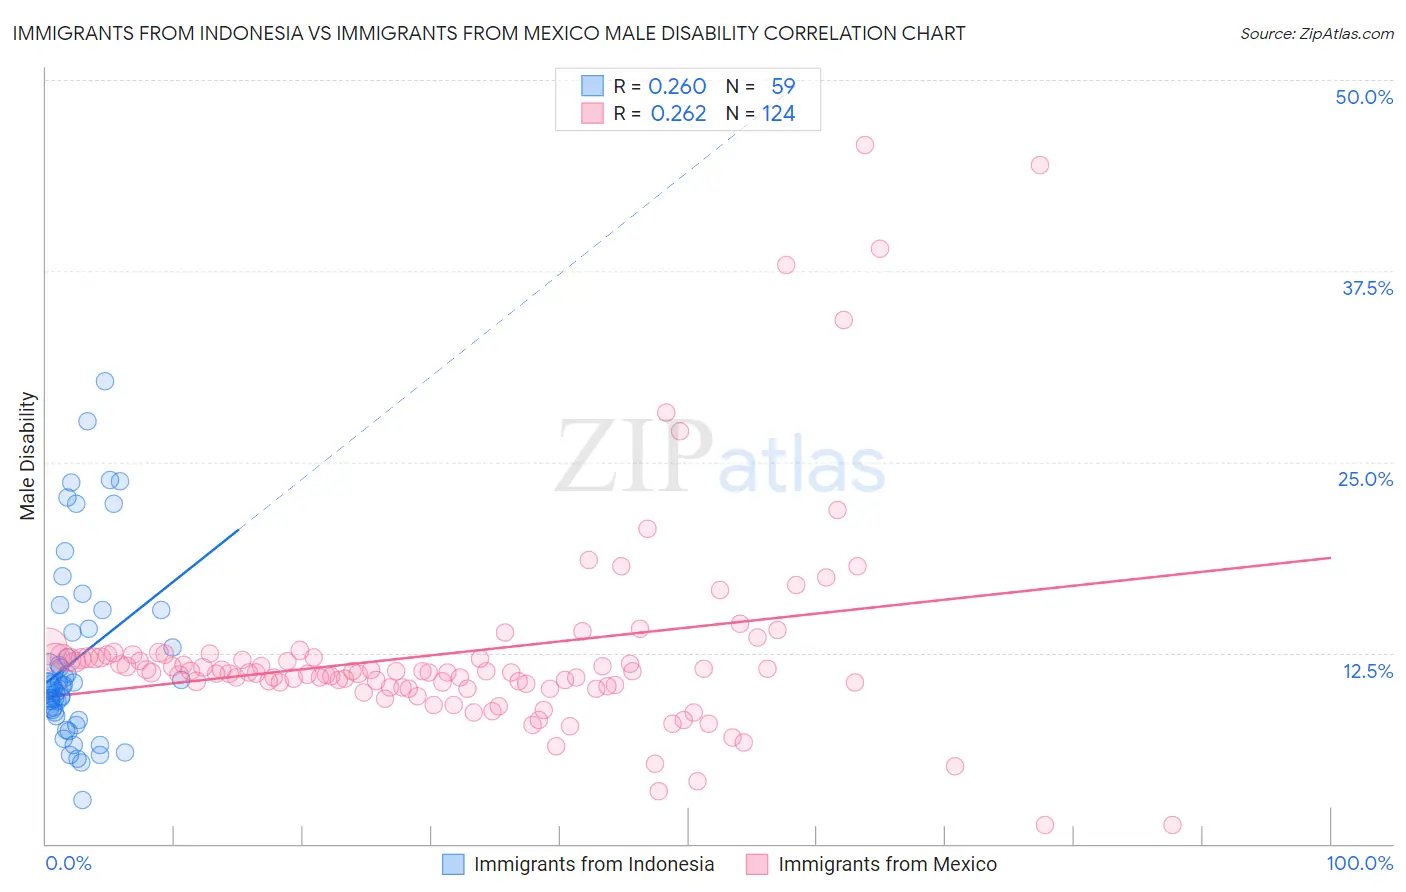
Immigrants from Indonesia vs Immigrants from Mexico Male Disability Correlation Chart
The statistical analysis conducted on geographies consisting of 215,790,379 people shows a weak positive correlation between the proportion of Immigrants from Indonesia and percentage of males with a disability in the United States with a correlation coefficient (R) of 0.260 and weighted average of 10.2%. Similarly, the statistical analysis conducted on geographies consisting of 513,525,240 people shows a weak positive correlation between the proportion of Immigrants from Mexico and percentage of males with a disability in the United States with a correlation coefficient (R) of 0.262 and weighted average of 11.5%, a difference of 12.7%.
Male Disability Correlation Summary
| Measurement | Immigrants from Indonesia | Immigrants from Mexico |
| Minimum | 2.9% | 1.2% |
| Maximum | 30.3% | 45.8% |
| Range | 27.4% | 44.6% |
| Mean | 12.0% | 12.5% |
| Median | 10.4% | 11.2% |
| Interquartile 25% (IQ1) | 8.6% | 10.3% |
| Interquartile 75% (IQ3) | 14.0% | 12.2% |
| Interquartile Range (IQR) | 5.4% | 1.9% |
| Standard Deviation (Sample) | 5.9% | 6.8% |
| Standard Deviation (Population) | 5.9% | 6.8% |
Similar Demographics by Male Disability
Demographics Similar to Immigrants from Indonesia by Male Disability
In terms of male disability, the demographic groups most similar to Immigrants from Indonesia are Ethiopian (10.2%, a difference of 0.070%), Immigrants from Argentina (10.2%, a difference of 0.12%), Immigrants from Kuwait (10.2%, a difference of 0.17%), Immigrants from Turkey (10.2%, a difference of 0.24%), and Immigrants from Ethiopia (10.2%, a difference of 0.30%).
| Demographics | Rating | Rank | Male Disability |
| Immigrants | Egypt | 99.9 /100 | #30 | Exceptional 10.1% |
| Soviet Union | 99.9 /100 | #31 | Exceptional 10.1% |
| Argentineans | 99.9 /100 | #32 | Exceptional 10.1% |
| Immigrants | Ethiopia | 99.9 /100 | #33 | Exceptional 10.2% |
| Immigrants | Turkey | 99.9 /100 | #34 | Exceptional 10.2% |
| Immigrants | Argentina | 99.9 /100 | #35 | Exceptional 10.2% |
| Ethiopians | 99.8 /100 | #36 | Exceptional 10.2% |
| Immigrants | Indonesia | 99.8 /100 | #37 | Exceptional 10.2% |
| Immigrants | Kuwait | 99.8 /100 | #38 | Exceptional 10.2% |
| Afghans | 99.8 /100 | #39 | Exceptional 10.2% |
| Immigrants | Nepal | 99.8 /100 | #40 | Exceptional 10.3% |
| Taiwanese | 99.8 /100 | #41 | Exceptional 10.3% |
| Mongolians | 99.7 /100 | #42 | Exceptional 10.3% |
| Immigrants | Bangladesh | 99.7 /100 | #43 | Exceptional 10.3% |
| Immigrants | El Salvador | 99.7 /100 | #44 | Exceptional 10.3% |
Demographics Similar to Immigrants from Mexico by Male Disability
In terms of male disability, the demographic groups most similar to Immigrants from Mexico are Immigrants from Iraq (11.5%, a difference of 0.040%), Immigrants from Panama (11.5%, a difference of 0.040%), Jamaican (11.5%, a difference of 0.23%), Immigrants from Cambodia (11.5%, a difference of 0.25%), and Serbian (11.5%, a difference of 0.25%).
| Demographics | Rating | Rank | Male Disability |
| Immigrants | Oceania | 20.9 /100 | #195 | Fair 11.4% |
| West Indians | 18.4 /100 | #196 | Poor 11.4% |
| Somalis | 18.2 /100 | #197 | Poor 11.4% |
| Immigrants | Jamaica | 16.3 /100 | #198 | Poor 11.5% |
| Lebanese | 15.4 /100 | #199 | Poor 11.5% |
| Immigrants | Iraq | 13.0 /100 | #200 | Poor 11.5% |
| Immigrants | Panama | 13.0 /100 | #201 | Poor 11.5% |
| Immigrants | Mexico | 12.6 /100 | #202 | Poor 11.5% |
| Jamaicans | 10.9 /100 | #203 | Poor 11.5% |
| Immigrants | Cambodia | 10.8 /100 | #204 | Poor 11.5% |
| Serbians | 10.7 /100 | #205 | Poor 11.5% |
| Ukrainians | 10.6 /100 | #206 | Poor 11.5% |
| Immigrants | Somalia | 10.4 /100 | #207 | Poor 11.5% |
| Icelanders | 10.1 /100 | #208 | Poor 11.6% |
| Spanish American Indians | 10.1 /100 | #209 | Poor 11.6% |