Immigrants from Morocco vs Cree Male Disability
COMPARE
Immigrants from Morocco
Cree
Male Disability
Male Disability Comparison
Immigrants from Morocco
Cree
10.6%
MALE DISABILITY
97.7/ 100
METRIC RATING
90th/ 347
METRIC RANK
13.7%
MALE DISABILITY
0.0/ 100
METRIC RATING
318th/ 347
METRIC RANK
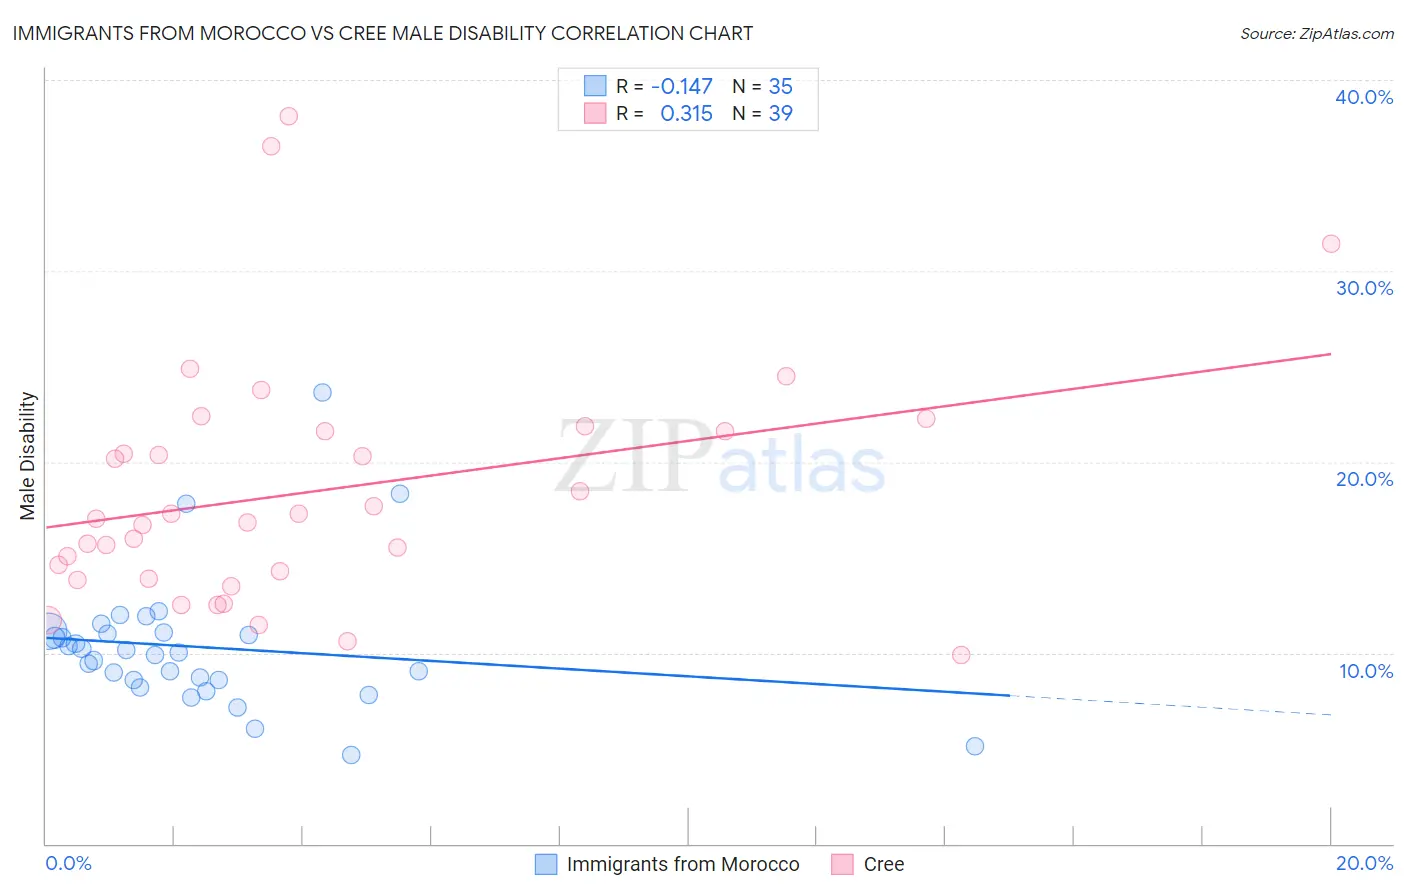
Immigrants from Morocco vs Cree Male Disability Correlation Chart
The statistical analysis conducted on geographies consisting of 178,909,638 people shows a poor negative correlation between the proportion of Immigrants from Morocco and percentage of males with a disability in the United States with a correlation coefficient (R) of -0.147 and weighted average of 10.6%. Similarly, the statistical analysis conducted on geographies consisting of 76,208,606 people shows a mild positive correlation between the proportion of Cree and percentage of males with a disability in the United States with a correlation coefficient (R) of 0.315 and weighted average of 13.7%, a difference of 28.9%.
Male Disability Correlation Summary
| Measurement | Immigrants from Morocco | Cree |
| Minimum | 4.6% | 9.9% |
| Maximum | 23.6% | 38.1% |
| Range | 19.0% | 28.2% |
| Mean | 10.3% | 18.5% |
| Median | 10.0% | 17.0% |
| Interquartile 25% (IQ1) | 8.5% | 13.9% |
| Interquartile 75% (IQ3) | 11.1% | 21.6% |
| Interquartile Range (IQR) | 2.5% | 7.7% |
| Standard Deviation (Sample) | 3.6% | 6.4% |
| Standard Deviation (Population) | 3.5% | 6.3% |
Similar Demographics by Male Disability
Demographics Similar to Immigrants from Morocco by Male Disability
In terms of male disability, the demographic groups most similar to Immigrants from Morocco are Immigrants from France (10.6%, a difference of 0.040%), Immigrants from Western Asia (10.6%, a difference of 0.050%), Immigrants from Nicaragua (10.6%, a difference of 0.050%), Immigrants from Vietnam (10.6%, a difference of 0.12%), and Immigrants from Ireland (10.6%, a difference of 0.14%).
| Demographics | Rating | Rank | Male Disability |
| Immigrants | Poland | 98.1 /100 | #83 | Exceptional 10.6% |
| Bulgarians | 98.1 /100 | #84 | Exceptional 10.6% |
| Sri Lankans | 97.9 /100 | #85 | Exceptional 10.6% |
| Immigrants | Ireland | 97.9 /100 | #86 | Exceptional 10.6% |
| Immigrants | Vietnam | 97.9 /100 | #87 | Exceptional 10.6% |
| Immigrants | Western Asia | 97.8 /100 | #88 | Exceptional 10.6% |
| Immigrants | Nicaragua | 97.8 /100 | #89 | Exceptional 10.6% |
| Immigrants | Morocco | 97.7 /100 | #90 | Exceptional 10.6% |
| Immigrants | France | 97.6 /100 | #91 | Exceptional 10.6% |
| Palestinians | 97.4 /100 | #92 | Exceptional 10.7% |
| Immigrants | St. Vincent and the Grenadines | 97.1 /100 | #93 | Exceptional 10.7% |
| Immigrants | Sweden | 96.9 /100 | #94 | Exceptional 10.7% |
| Chileans | 96.9 /100 | #95 | Exceptional 10.7% |
| Nicaraguans | 96.6 /100 | #96 | Exceptional 10.7% |
| Immigrants | Armenia | 96.6 /100 | #97 | Exceptional 10.7% |
Demographics Similar to Cree by Male Disability
In terms of male disability, the demographic groups most similar to Cree are Paiute (13.7%, a difference of 0.21%), American (13.8%, a difference of 0.41%), Tlingit-Haida (13.8%, a difference of 0.90%), Shoshone (13.8%, a difference of 0.96%), and Alaska Native (13.6%, a difference of 1.0%).
| Demographics | Rating | Rank | Male Disability |
| Delaware | 0.0 /100 | #311 | Tragic 13.5% |
| Yakama | 0.0 /100 | #312 | Tragic 13.5% |
| Puget Sound Salish | 0.0 /100 | #313 | Tragic 13.5% |
| Aleuts | 0.0 /100 | #314 | Tragic 13.5% |
| Iroquois | 0.0 /100 | #315 | Tragic 13.6% |
| Alaska Natives | 0.0 /100 | #316 | Tragic 13.6% |
| Paiute | 0.0 /100 | #317 | Tragic 13.7% |
| Cree | 0.0 /100 | #318 | Tragic 13.7% |
| Americans | 0.0 /100 | #319 | Tragic 13.8% |
| Tlingit-Haida | 0.0 /100 | #320 | Tragic 13.8% |
| Shoshone | 0.0 /100 | #321 | Tragic 13.8% |
| Apache | 0.0 /100 | #322 | Tragic 14.0% |
| Osage | 0.0 /100 | #323 | Tragic 14.0% |
| Comanche | 0.0 /100 | #324 | Tragic 14.1% |
| Ottawa | 0.0 /100 | #325 | Tragic 14.1% |