Immigrants from Indonesia vs Cree Median Earnings
COMPARE
Immigrants from Indonesia
Cree
Median Earnings
Median Earnings Comparison
Immigrants from Indonesia
Cree
$51,715
MEDIAN EARNINGS
99.9/ 100
METRIC RATING
54th/ 347
METRIC RANK
$42,777
MEDIAN EARNINGS
0.6/ 100
METRIC RATING
267th/ 347
METRIC RANK
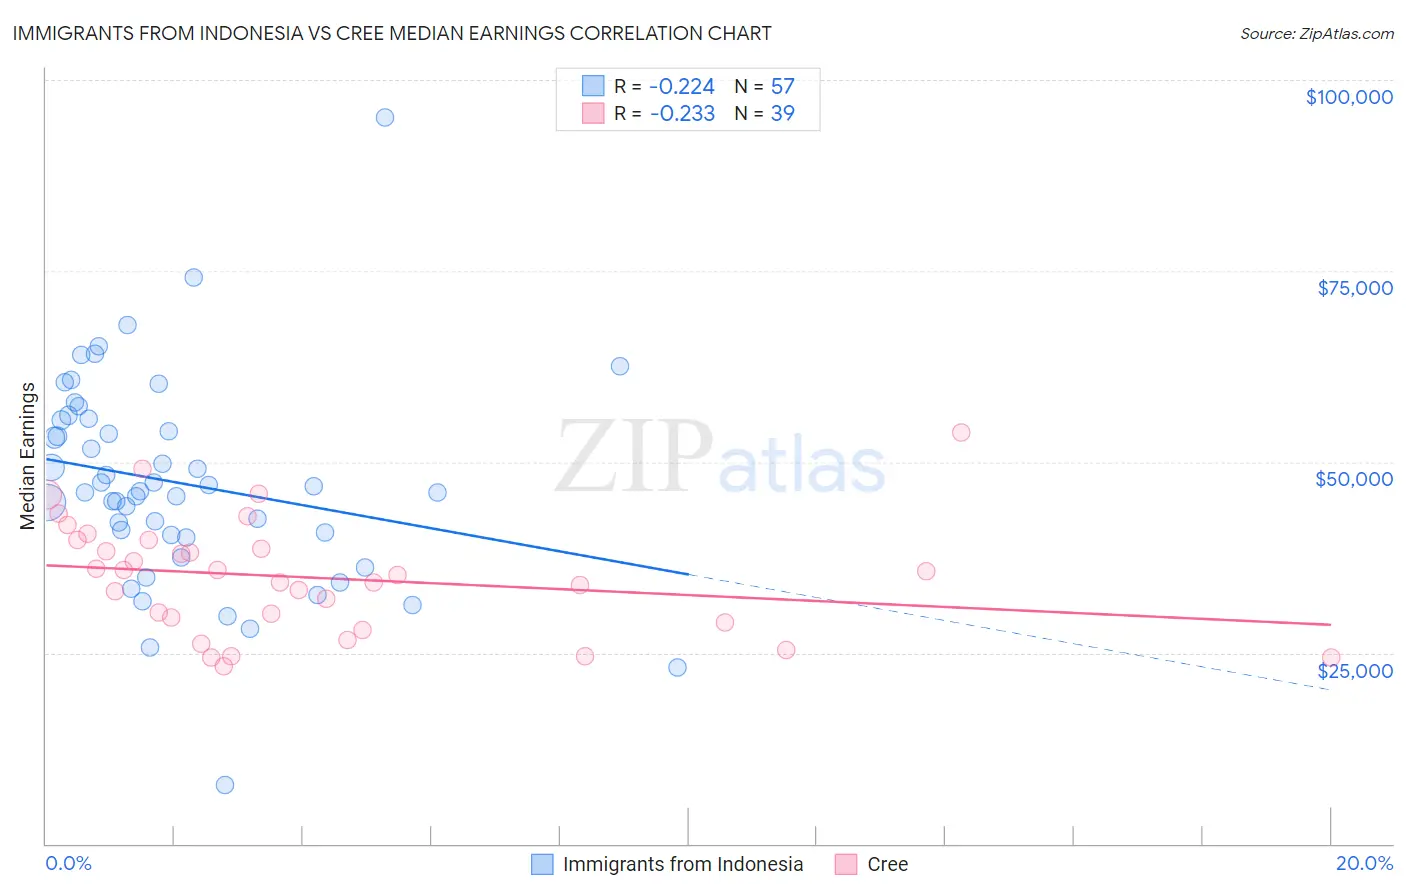
Immigrants from Indonesia vs Cree Median Earnings Correlation Chart
The statistical analysis conducted on geographies consisting of 215,769,238 people shows a weak negative correlation between the proportion of Immigrants from Indonesia and median earnings in the United States with a correlation coefficient (R) of -0.224 and weighted average of $51,715. Similarly, the statistical analysis conducted on geographies consisting of 76,210,467 people shows a weak negative correlation between the proportion of Cree and median earnings in the United States with a correlation coefficient (R) of -0.233 and weighted average of $42,777, a difference of 20.9%.
Median Earnings Correlation Summary
| Measurement | Immigrants from Indonesia | Cree |
| Minimum | $7,703 | $23,200 |
| Maximum | $95,117 | $53,900 |
| Range | $87,414 | $30,700 |
| Mean | $47,201 | $34,814 |
| Median | $46,101 | $35,233 |
| Interquartile 25% (IQ1) | $40,269 | $28,896 |
| Interquartile 75% (IQ3) | $55,574 | $39,775 |
| Interquartile Range (IQR) | $15,305 | $10,879 |
| Standard Deviation (Sample) | $13,842 | $7,415 |
| Standard Deviation (Population) | $13,720 | $7,320 |
Similar Demographics by Median Earnings
Demographics Similar to Immigrants from Indonesia by Median Earnings
In terms of median earnings, the demographic groups most similar to Immigrants from Indonesia are Egyptian ($51,701, a difference of 0.030%), Immigrants from Pakistan ($51,693, a difference of 0.040%), Immigrants from Norway ($51,758, a difference of 0.080%), Estonian ($51,772, a difference of 0.11%), and Immigrants from Eastern Europe ($51,624, a difference of 0.18%).
| Demographics | Rating | Rank | Median Earnings |
| Australians | 100.0 /100 | #47 | Exceptional $52,294 |
| Immigrants | Europe | 100.0 /100 | #48 | Exceptional $52,195 |
| Bolivians | 100.0 /100 | #49 | Exceptional $52,005 |
| Immigrants | South Africa | 100.0 /100 | #50 | Exceptional $51,850 |
| Immigrants | Austria | 99.9 /100 | #51 | Exceptional $51,826 |
| Estonians | 99.9 /100 | #52 | Exceptional $51,772 |
| Immigrants | Norway | 99.9 /100 | #53 | Exceptional $51,758 |
| Immigrants | Indonesia | 99.9 /100 | #54 | Exceptional $51,715 |
| Egyptians | 99.9 /100 | #55 | Exceptional $51,701 |
| Immigrants | Pakistan | 99.9 /100 | #56 | Exceptional $51,693 |
| Immigrants | Eastern Europe | 99.9 /100 | #57 | Exceptional $51,624 |
| Immigrants | Bolivia | 99.9 /100 | #58 | Exceptional $51,605 |
| Immigrants | Croatia | 99.9 /100 | #59 | Exceptional $51,581 |
| Immigrants | Serbia | 99.9 /100 | #60 | Exceptional $51,557 |
| Immigrants | Latvia | 99.9 /100 | #61 | Exceptional $51,555 |
Demographics Similar to Cree by Median Earnings
In terms of median earnings, the demographic groups most similar to Cree are American ($42,742, a difference of 0.080%), Belizean ($42,702, a difference of 0.17%), Immigrants from Laos ($42,884, a difference of 0.25%), Osage ($42,651, a difference of 0.29%), and Salvadoran ($42,912, a difference of 0.32%).
| Demographics | Rating | Rank | Median Earnings |
| Immigrants | Somalia | 0.9 /100 | #260 | Tragic $43,100 |
| Immigrants | Jamaica | 0.8 /100 | #261 | Tragic $43,026 |
| Nicaraguans | 0.8 /100 | #262 | Tragic $43,026 |
| Inupiat | 0.8 /100 | #263 | Tragic $43,000 |
| Immigrants | Liberia | 0.7 /100 | #264 | Tragic $42,923 |
| Salvadorans | 0.7 /100 | #265 | Tragic $42,912 |
| Immigrants | Laos | 0.7 /100 | #266 | Tragic $42,884 |
| Cree | 0.6 /100 | #267 | Tragic $42,777 |
| Americans | 0.6 /100 | #268 | Tragic $42,742 |
| Belizeans | 0.5 /100 | #269 | Tragic $42,702 |
| Osage | 0.5 /100 | #270 | Tragic $42,651 |
| Pennsylvania Germans | 0.5 /100 | #271 | Tragic $42,615 |
| Iroquois | 0.4 /100 | #272 | Tragic $42,430 |
| Immigrants | Dominica | 0.4 /100 | #273 | Tragic $42,420 |
| Immigrants | El Salvador | 0.4 /100 | #274 | Tragic $42,413 |