Hmong vs Cree Male Disability
COMPARE
Hmong
Cree
Male Disability
Male Disability Comparison
Hmong
Cree
12.5%
MALE DISABILITY
0.0/ 100
METRIC RATING
272nd/ 347
METRIC RANK
13.7%
MALE DISABILITY
0.0/ 100
METRIC RATING
318th/ 347
METRIC RANK
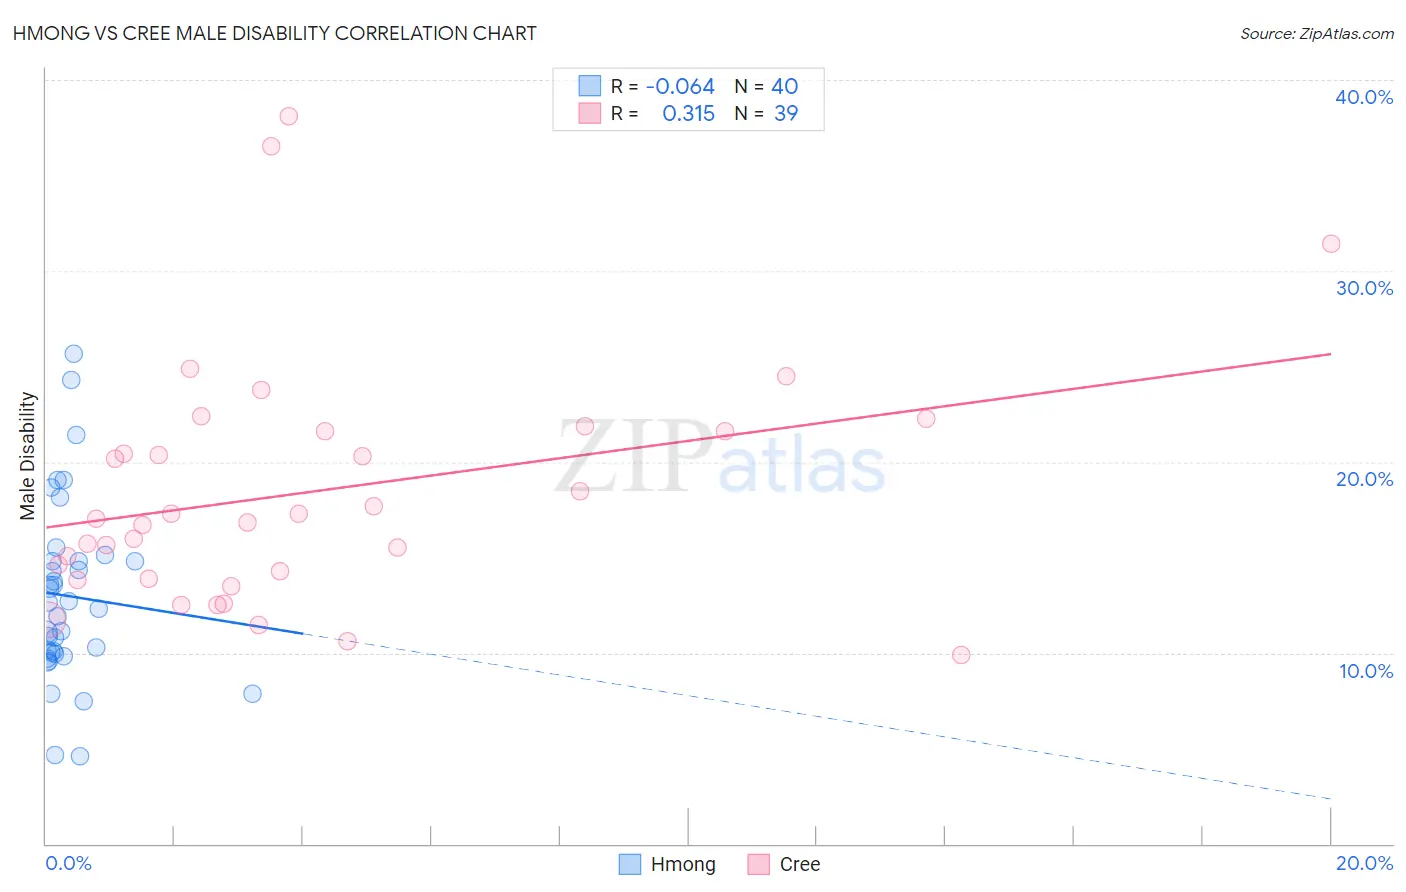
Hmong vs Cree Male Disability Correlation Chart
The statistical analysis conducted on geographies consisting of 24,681,537 people shows a slight negative correlation between the proportion of Hmong and percentage of males with a disability in the United States with a correlation coefficient (R) of -0.064 and weighted average of 12.5%. Similarly, the statistical analysis conducted on geographies consisting of 76,208,606 people shows a mild positive correlation between the proportion of Cree and percentage of males with a disability in the United States with a correlation coefficient (R) of 0.315 and weighted average of 13.7%, a difference of 10.0%.
Male Disability Correlation Summary
| Measurement | Hmong | Cree |
| Minimum | 4.6% | 9.9% |
| Maximum | 25.6% | 38.1% |
| Range | 21.1% | 28.2% |
| Mean | 13.0% | 18.5% |
| Median | 12.5% | 17.0% |
| Interquartile 25% (IQ1) | 10.0% | 13.9% |
| Interquartile 75% (IQ3) | 14.8% | 21.6% |
| Interquartile Range (IQR) | 4.8% | 7.7% |
| Standard Deviation (Sample) | 4.7% | 6.4% |
| Standard Deviation (Population) | 4.6% | 6.3% |
Similar Demographics by Male Disability
Demographics Similar to Hmong by Male Disability
In terms of male disability, the demographic groups most similar to Hmong are Native Hawaiian (12.5%, a difference of 0.060%), Hopi (12.5%, a difference of 0.39%), Fijian (12.6%, a difference of 0.75%), African (12.6%, a difference of 0.80%), and Finnish (12.6%, a difference of 1.1%).
| Demographics | Rating | Rank | Male Disability |
| Immigrants | Portugal | 0.1 /100 | #265 | Tragic 12.3% |
| Hawaiians | 0.1 /100 | #266 | Tragic 12.3% |
| Immigrants | Germany | 0.1 /100 | #267 | Tragic 12.3% |
| Portuguese | 0.1 /100 | #268 | Tragic 12.3% |
| Czechoslovakians | 0.1 /100 | #269 | Tragic 12.3% |
| Spaniards | 0.1 /100 | #270 | Tragic 12.3% |
| Scandinavians | 0.1 /100 | #271 | Tragic 12.3% |
| Hmong | 0.0 /100 | #272 | Tragic 12.5% |
| Native Hawaiians | 0.0 /100 | #273 | Tragic 12.5% |
| Hopi | 0.0 /100 | #274 | Tragic 12.5% |
| Fijians | 0.0 /100 | #275 | Tragic 12.6% |
| Africans | 0.0 /100 | #276 | Tragic 12.6% |
| Finns | 0.0 /100 | #277 | Tragic 12.6% |
| Central American Indians | 0.0 /100 | #278 | Tragic 12.7% |
| Slovaks | 0.0 /100 | #279 | Tragic 12.7% |
Demographics Similar to Cree by Male Disability
In terms of male disability, the demographic groups most similar to Cree are Paiute (13.7%, a difference of 0.21%), American (13.8%, a difference of 0.41%), Tlingit-Haida (13.8%, a difference of 0.90%), Shoshone (13.8%, a difference of 0.96%), and Alaska Native (13.6%, a difference of 1.0%).
| Demographics | Rating | Rank | Male Disability |
| Delaware | 0.0 /100 | #311 | Tragic 13.5% |
| Yakama | 0.0 /100 | #312 | Tragic 13.5% |
| Puget Sound Salish | 0.0 /100 | #313 | Tragic 13.5% |
| Aleuts | 0.0 /100 | #314 | Tragic 13.5% |
| Iroquois | 0.0 /100 | #315 | Tragic 13.6% |
| Alaska Natives | 0.0 /100 | #316 | Tragic 13.6% |
| Paiute | 0.0 /100 | #317 | Tragic 13.7% |
| Cree | 0.0 /100 | #318 | Tragic 13.7% |
| Americans | 0.0 /100 | #319 | Tragic 13.8% |
| Tlingit-Haida | 0.0 /100 | #320 | Tragic 13.8% |
| Shoshone | 0.0 /100 | #321 | Tragic 13.8% |
| Apache | 0.0 /100 | #322 | Tragic 14.0% |
| Osage | 0.0 /100 | #323 | Tragic 14.0% |
| Comanche | 0.0 /100 | #324 | Tragic 14.1% |
| Ottawa | 0.0 /100 | #325 | Tragic 14.1% |