Immigrants from Saudi Arabia vs West Indian Disability
COMPARE
Immigrants from Saudi Arabia
West Indian
Disability
Disability Comparison
Immigrants from Saudi Arabia
West Indians
10.9%
DISABILITY
99.9/ 100
METRIC RATING
50th/ 347
METRIC RANK
12.2%
DISABILITY
2.9/ 100
METRIC RATING
228th/ 347
METRIC RANK
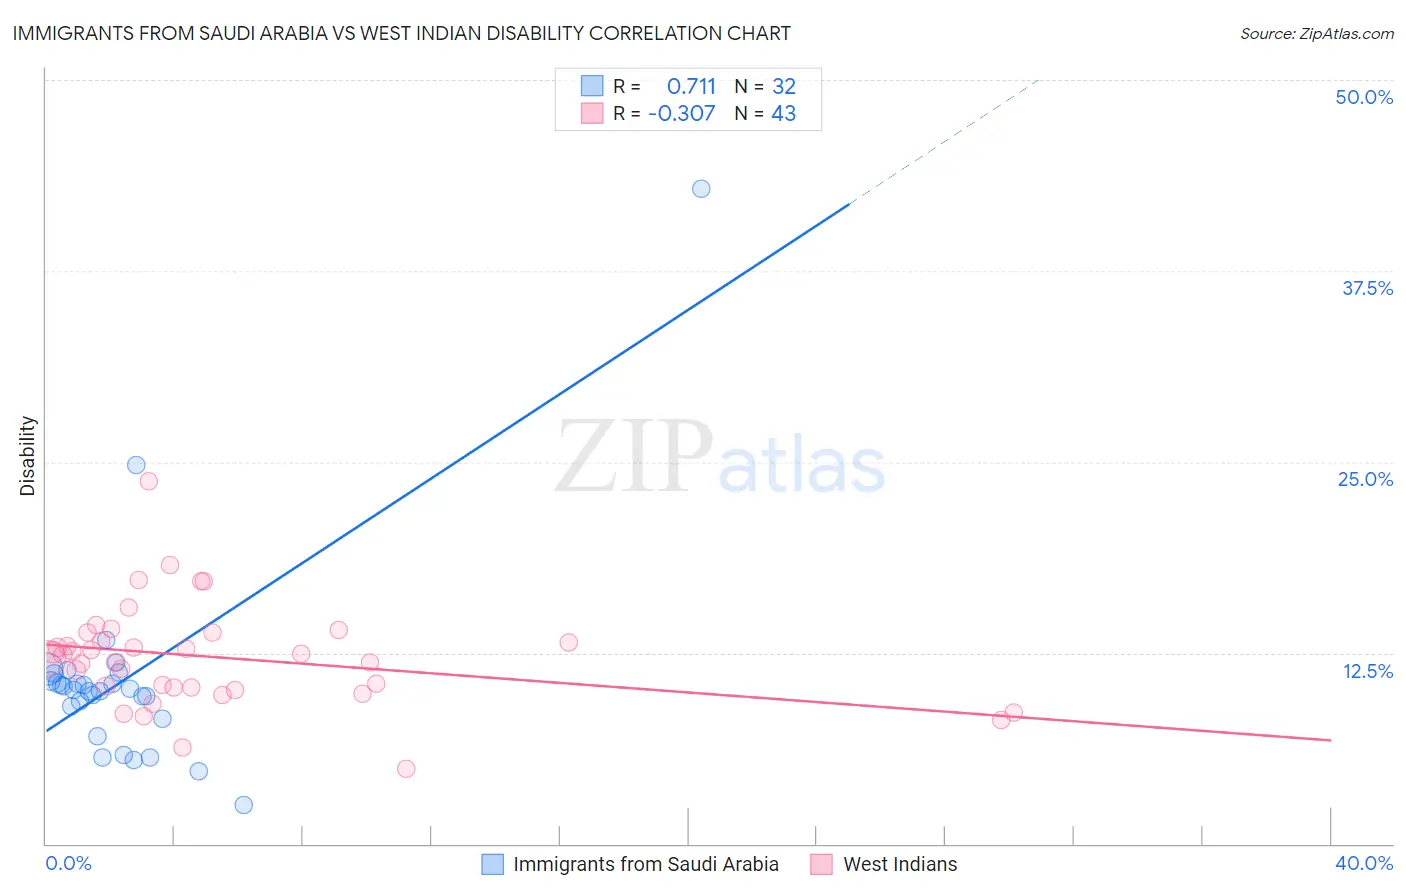
Immigrants from Saudi Arabia vs West Indian Disability Correlation Chart
The statistical analysis conducted on geographies consisting of 164,295,639 people shows a strong positive correlation between the proportion of Immigrants from Saudi Arabia and percentage of population with a disability in the United States with a correlation coefficient (R) of 0.711 and weighted average of 10.9%. Similarly, the statistical analysis conducted on geographies consisting of 254,018,929 people shows a mild negative correlation between the proportion of West Indians and percentage of population with a disability in the United States with a correlation coefficient (R) of -0.307 and weighted average of 12.2%, a difference of 11.9%.
Disability Correlation Summary
| Measurement | Immigrants from Saudi Arabia | West Indian |
| Minimum | 2.6% | 4.9% |
| Maximum | 42.9% | 23.8% |
| Range | 40.3% | 18.9% |
| Mean | 10.8% | 12.2% |
| Median | 10.1% | 12.4% |
| Interquartile 25% (IQ1) | 8.6% | 10.2% |
| Interquartile 75% (IQ3) | 10.9% | 13.9% |
| Interquartile Range (IQR) | 2.3% | 3.7% |
| Standard Deviation (Sample) | 6.9% | 3.3% |
| Standard Deviation (Population) | 6.8% | 3.3% |
Similar Demographics by Disability
Demographics Similar to Immigrants from Saudi Arabia by Disability
In terms of disability, the demographic groups most similar to Immigrants from Saudi Arabia are Vietnamese (10.9%, a difference of 0.0%), Peruvian (10.9%, a difference of 0.010%), Soviet Union (10.9%, a difference of 0.060%), South American (10.9%, a difference of 0.070%), and Immigrants from Spain (10.9%, a difference of 0.090%).
| Demographics | Rating | Rank | Disability |
| Israelis | 99.9 /100 | #43 | Exceptional 10.8% |
| Immigrants | Japan | 99.9 /100 | #44 | Exceptional 10.8% |
| Immigrants | Peru | 99.9 /100 | #45 | Exceptional 10.8% |
| Tongans | 99.9 /100 | #46 | Exceptional 10.8% |
| Taiwanese | 99.9 /100 | #47 | Exceptional 10.8% |
| Soviet Union | 99.9 /100 | #48 | Exceptional 10.9% |
| Vietnamese | 99.9 /100 | #49 | Exceptional 10.9% |
| Immigrants | Saudi Arabia | 99.9 /100 | #50 | Exceptional 10.9% |
| Peruvians | 99.8 /100 | #51 | Exceptional 10.9% |
| South Americans | 99.8 /100 | #52 | Exceptional 10.9% |
| Immigrants | Spain | 99.8 /100 | #53 | Exceptional 10.9% |
| Jordanians | 99.8 /100 | #54 | Exceptional 10.9% |
| Immigrants | El Salvador | 99.8 /100 | #55 | Exceptional 10.9% |
| Immigrants | Lithuania | 99.8 /100 | #56 | Exceptional 10.9% |
| Salvadorans | 99.8 /100 | #57 | Exceptional 10.9% |
Demographics Similar to West Indians by Disability
In terms of disability, the demographic groups most similar to West Indians are Inupiat (12.2%, a difference of 0.020%), Samoan (12.2%, a difference of 0.10%), Malaysian (12.2%, a difference of 0.13%), Alsatian (12.1%, a difference of 0.14%), and Italian (12.2%, a difference of 0.14%).
| Demographics | Rating | Rank | Disability |
| Northern Europeans | 4.2 /100 | #221 | Tragic 12.1% |
| Spanish American Indians | 4.1 /100 | #222 | Tragic 12.1% |
| Hispanics or Latinos | 3.9 /100 | #223 | Tragic 12.1% |
| Mexicans | 3.7 /100 | #224 | Tragic 12.1% |
| Senegalese | 3.5 /100 | #225 | Tragic 12.1% |
| Jamaicans | 3.3 /100 | #226 | Tragic 12.1% |
| Alsatians | 3.3 /100 | #227 | Tragic 12.1% |
| West Indians | 2.9 /100 | #228 | Tragic 12.2% |
| Inupiat | 2.8 /100 | #229 | Tragic 12.2% |
| Samoans | 2.6 /100 | #230 | Tragic 12.2% |
| Malaysians | 2.5 /100 | #231 | Tragic 12.2% |
| Italians | 2.5 /100 | #232 | Tragic 12.2% |
| Bahamians | 2.3 /100 | #233 | Tragic 12.2% |
| Japanese | 2.3 /100 | #234 | Tragic 12.2% |
| Yup'ik | 2.2 /100 | #235 | Tragic 12.2% |