Immigrants from Cuba vs West Indian Disability
COMPARE
Immigrants from Cuba
West Indian
Disability
Disability Comparison
Immigrants from Cuba
West Indians
11.6%
DISABILITY
62.8/ 100
METRIC RATING
161st/ 347
METRIC RANK
12.2%
DISABILITY
2.9/ 100
METRIC RATING
228th/ 347
METRIC RANK
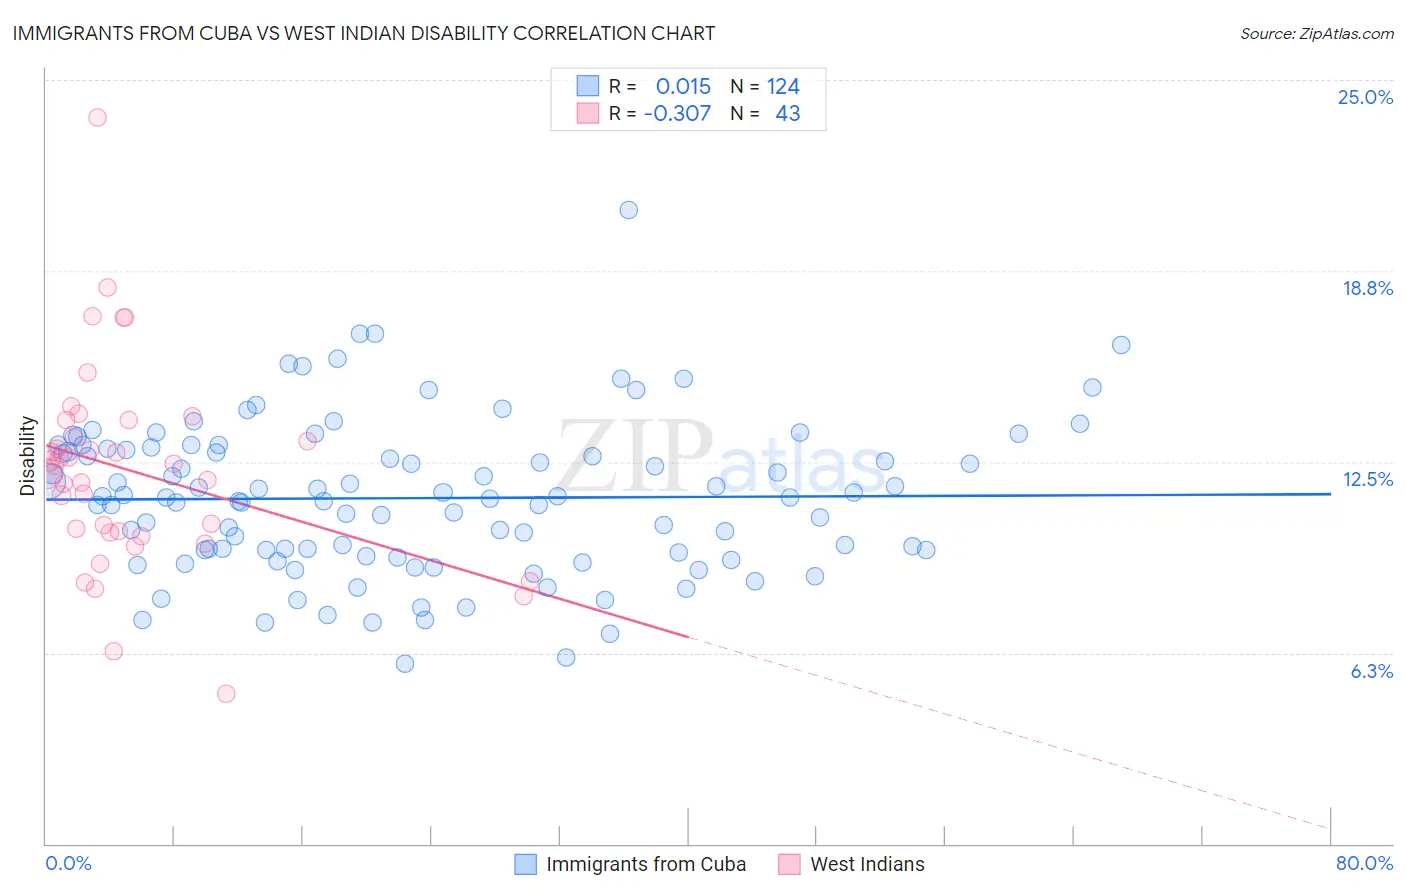
Immigrants from Cuba vs West Indian Disability Correlation Chart
The statistical analysis conducted on geographies consisting of 325,999,543 people shows no correlation between the proportion of Immigrants from Cuba and percentage of population with a disability in the United States with a correlation coefficient (R) of 0.015 and weighted average of 11.6%. Similarly, the statistical analysis conducted on geographies consisting of 254,018,929 people shows a mild negative correlation between the proportion of West Indians and percentage of population with a disability in the United States with a correlation coefficient (R) of -0.307 and weighted average of 12.2%, a difference of 4.5%.
Disability Correlation Summary
| Measurement | Immigrants from Cuba | West Indian |
| Minimum | 5.9% | 4.9% |
| Maximum | 20.7% | 23.8% |
| Range | 14.8% | 18.9% |
| Mean | 11.3% | 12.2% |
| Median | 11.3% | 12.4% |
| Interquartile 25% (IQ1) | 9.6% | 10.2% |
| Interquartile 75% (IQ3) | 12.9% | 13.9% |
| Interquartile Range (IQR) | 3.3% | 3.7% |
| Standard Deviation (Sample) | 2.5% | 3.3% |
| Standard Deviation (Population) | 2.5% | 3.3% |
Similar Demographics by Disability
Demographics Similar to Immigrants from Cuba by Disability
In terms of disability, the demographic groups most similar to Immigrants from Cuba are Immigrants from Barbados (11.6%, a difference of 0.070%), Guatemalan (11.6%, a difference of 0.11%), Armenian (11.6%, a difference of 0.15%), Immigrants from Haiti (11.7%, a difference of 0.17%), and Immigrants from Trinidad and Tobago (11.7%, a difference of 0.19%).
| Demographics | Rating | Rank | Disability |
| Immigrants | Guatemala | 71.1 /100 | #154 | Good 11.6% |
| Immigrants | Netherlands | 69.8 /100 | #155 | Good 11.6% |
| Immigrants | Fiji | 69.5 /100 | #156 | Good 11.6% |
| Immigrants | Middle Africa | 69.5 /100 | #157 | Good 11.6% |
| Armenians | 65.9 /100 | #158 | Good 11.6% |
| Guatemalans | 65.1 /100 | #159 | Good 11.6% |
| Immigrants | Barbados | 64.2 /100 | #160 | Good 11.6% |
| Immigrants | Cuba | 62.8 /100 | #161 | Good 11.6% |
| Immigrants | Haiti | 59.2 /100 | #162 | Average 11.7% |
| Immigrants | Trinidad and Tobago | 58.9 /100 | #163 | Average 11.7% |
| Syrians | 58.5 /100 | #164 | Average 11.7% |
| Cubans | 56.7 /100 | #165 | Average 11.7% |
| Pakistanis | 54.7 /100 | #166 | Average 11.7% |
| Estonians | 54.4 /100 | #167 | Average 11.7% |
| Immigrants | Latin America | 54.1 /100 | #168 | Average 11.7% |
Demographics Similar to West Indians by Disability
In terms of disability, the demographic groups most similar to West Indians are Inupiat (12.2%, a difference of 0.020%), Samoan (12.2%, a difference of 0.10%), Malaysian (12.2%, a difference of 0.13%), Alsatian (12.1%, a difference of 0.14%), and Italian (12.2%, a difference of 0.14%).
| Demographics | Rating | Rank | Disability |
| Northern Europeans | 4.2 /100 | #221 | Tragic 12.1% |
| Spanish American Indians | 4.1 /100 | #222 | Tragic 12.1% |
| Hispanics or Latinos | 3.9 /100 | #223 | Tragic 12.1% |
| Mexicans | 3.7 /100 | #224 | Tragic 12.1% |
| Senegalese | 3.5 /100 | #225 | Tragic 12.1% |
| Jamaicans | 3.3 /100 | #226 | Tragic 12.1% |
| Alsatians | 3.3 /100 | #227 | Tragic 12.1% |
| West Indians | 2.9 /100 | #228 | Tragic 12.2% |
| Inupiat | 2.8 /100 | #229 | Tragic 12.2% |
| Samoans | 2.6 /100 | #230 | Tragic 12.2% |
| Malaysians | 2.5 /100 | #231 | Tragic 12.2% |
| Italians | 2.5 /100 | #232 | Tragic 12.2% |
| Bahamians | 2.3 /100 | #233 | Tragic 12.2% |
| Japanese | 2.3 /100 | #234 | Tragic 12.2% |
| Yup'ik | 2.2 /100 | #235 | Tragic 12.2% |