Immigrants from Honduras vs Marshallese 11th Grade
COMPARE
Immigrants from Honduras
Marshallese
11th Grade
11th Grade Comparison
Immigrants from Honduras
Marshallese
86.9%
11TH GRADE
0.0/ 100
METRIC RATING
337th/ 347
METRIC RANK
92.3%
11TH GRADE
26.0/ 100
METRIC RATING
197th/ 347
METRIC RANK
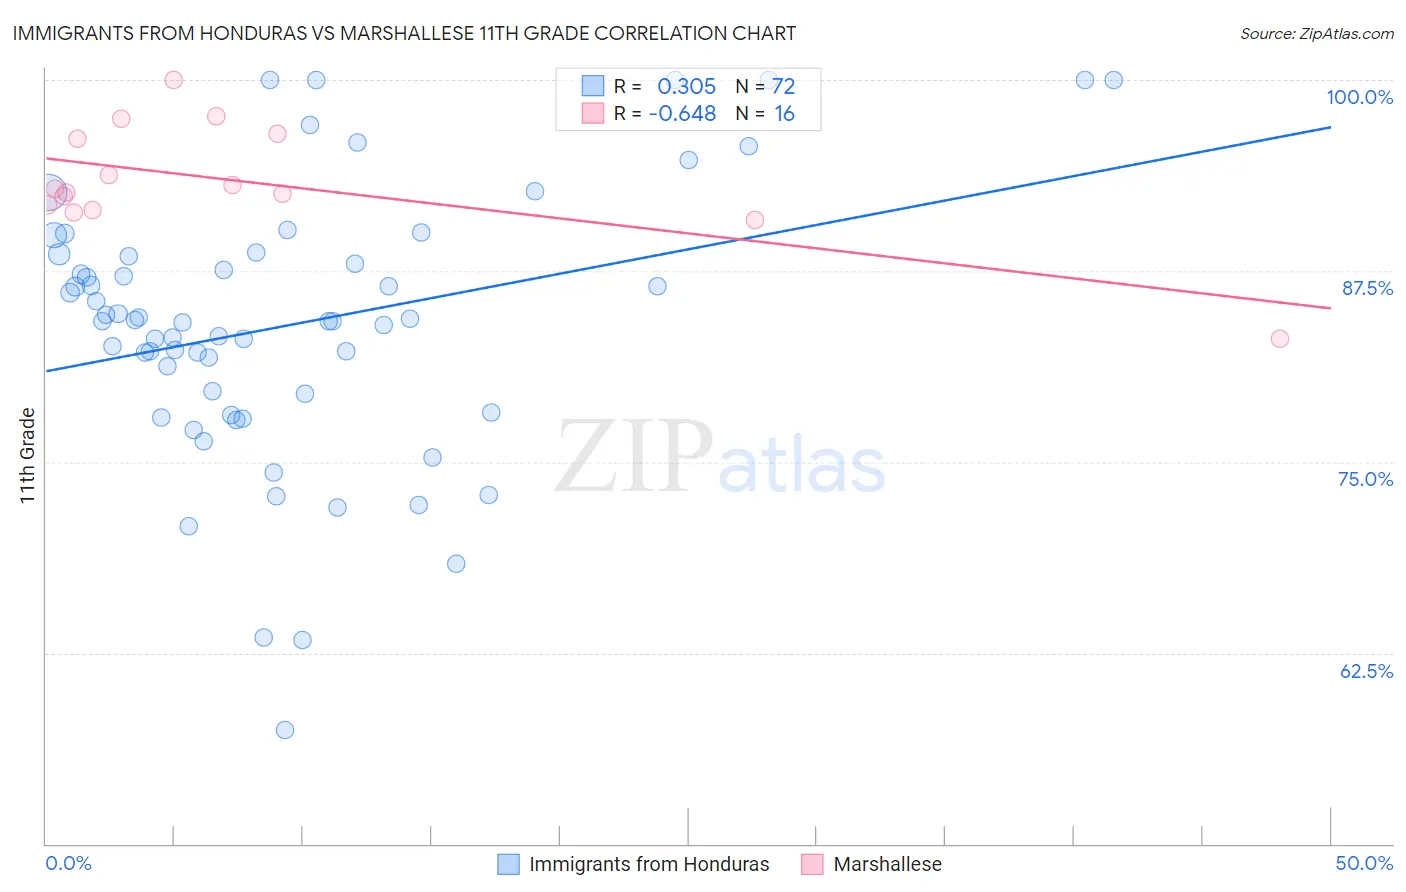
Immigrants from Honduras vs Marshallese 11th Grade Correlation Chart
The statistical analysis conducted on geographies consisting of 322,637,445 people shows a mild positive correlation between the proportion of Immigrants from Honduras and percentage of population with at least 11th grade education in the United States with a correlation coefficient (R) of 0.305 and weighted average of 86.9%. Similarly, the statistical analysis conducted on geographies consisting of 14,761,315 people shows a significant negative correlation between the proportion of Marshallese and percentage of population with at least 11th grade education in the United States with a correlation coefficient (R) of -0.648 and weighted average of 92.3%, a difference of 6.2%.
11th Grade Correlation Summary
| Measurement | Immigrants from Honduras | Marshallese |
| Minimum | 57.4% | 83.0% |
| Maximum | 100.0% | 100.0% |
| Range | 42.6% | 17.0% |
| Mean | 84.0% | 93.3% |
| Median | 84.2% | 92.8% |
| Interquartile 25% (IQ1) | 78.8% | 91.7% |
| Interquartile 75% (IQ3) | 88.5% | 96.3% |
| Interquartile Range (IQR) | 9.7% | 4.6% |
| Standard Deviation (Sample) | 8.9% | 3.8% |
| Standard Deviation (Population) | 8.8% | 3.7% |
Similar Demographics by 11th Grade
Demographics Similar to Immigrants from Honduras by 11th Grade
In terms of 11th grade, the demographic groups most similar to Immigrants from Honduras are Immigrants from Dominican Republic (86.9%, a difference of 0.0%), Central American (86.9%, a difference of 0.040%), Immigrants from Latin America (86.8%, a difference of 0.12%), Houma (87.0%, a difference of 0.14%), and Immigrants from Yemen (87.1%, a difference of 0.21%).
| Demographics | Rating | Rank | 11th Grade |
| Hondurans | 0.0 /100 | #330 | Tragic 87.4% |
| Hispanics or Latinos | 0.0 /100 | #331 | Tragic 87.3% |
| Immigrants | Azores | 0.0 /100 | #332 | Tragic 87.2% |
| Immigrants | Yemen | 0.0 /100 | #333 | Tragic 87.1% |
| Houma | 0.0 /100 | #334 | Tragic 87.0% |
| Central Americans | 0.0 /100 | #335 | Tragic 86.9% |
| Immigrants | Dominican Republic | 0.0 /100 | #336 | Tragic 86.9% |
| Immigrants | Honduras | 0.0 /100 | #337 | Tragic 86.9% |
| Immigrants | Latin America | 0.0 /100 | #338 | Tragic 86.8% |
| Guatemalans | 0.0 /100 | #339 | Tragic 86.4% |
| Salvadorans | 0.0 /100 | #340 | Tragic 86.2% |
| Mexicans | 0.0 /100 | #341 | Tragic 86.1% |
| Immigrants | Guatemala | 0.0 /100 | #342 | Tragic 85.8% |
| Immigrants | El Salvador | 0.0 /100 | #343 | Tragic 85.3% |
| Yakama | 0.0 /100 | #344 | Tragic 85.0% |
Demographics Similar to Marshallese by 11th Grade
In terms of 11th grade, the demographic groups most similar to Marshallese are Liberian (92.3%, a difference of 0.010%), Panamanian (92.3%, a difference of 0.010%), Hawaiian (92.3%, a difference of 0.010%), Immigrants from Uganda (92.3%, a difference of 0.010%), and Samoan (92.3%, a difference of 0.010%).
| Demographics | Rating | Rank | 11th Grade |
| Chickasaw | 31.4 /100 | #190 | Fair 92.3% |
| French American Indians | 30.8 /100 | #191 | Fair 92.3% |
| Immigrants | Syria | 30.4 /100 | #192 | Fair 92.3% |
| Moroccans | 28.7 /100 | #193 | Fair 92.3% |
| Sioux | 28.5 /100 | #194 | Fair 92.3% |
| Liberians | 26.8 /100 | #195 | Fair 92.3% |
| Panamanians | 26.4 /100 | #196 | Fair 92.3% |
| Marshallese | 26.0 /100 | #197 | Fair 92.3% |
| Hawaiians | 25.5 /100 | #198 | Fair 92.3% |
| Immigrants | Uganda | 25.2 /100 | #199 | Fair 92.3% |
| Samoans | 25.1 /100 | #200 | Fair 92.3% |
| Immigrants | China | 25.1 /100 | #201 | Fair 92.3% |
| Immigrants | Eastern Africa | 24.1 /100 | #202 | Fair 92.3% |
| Immigrants | Sudan | 23.5 /100 | #203 | Fair 92.3% |
| Immigrants | Hong Kong | 23.3 /100 | #204 | Fair 92.2% |