Immigrants from Honduras vs Aleut Householder Income Ages 25 - 44 years
COMPARE
Immigrants from Honduras
Aleut
Householder Income Ages 25 - 44 years
Householder Income Ages 25 - 44 years Comparison
Immigrants from Honduras
Aleuts
$77,328
HOUSEHOLDER INCOME AGES 25 - 44 YEARS
0.0/ 100
METRIC RATING
323rd/ 347
METRIC RANK
$91,370
HOUSEHOLDER INCOME AGES 25 - 44 YEARS
14.5/ 100
METRIC RATING
206th/ 347
METRIC RANK
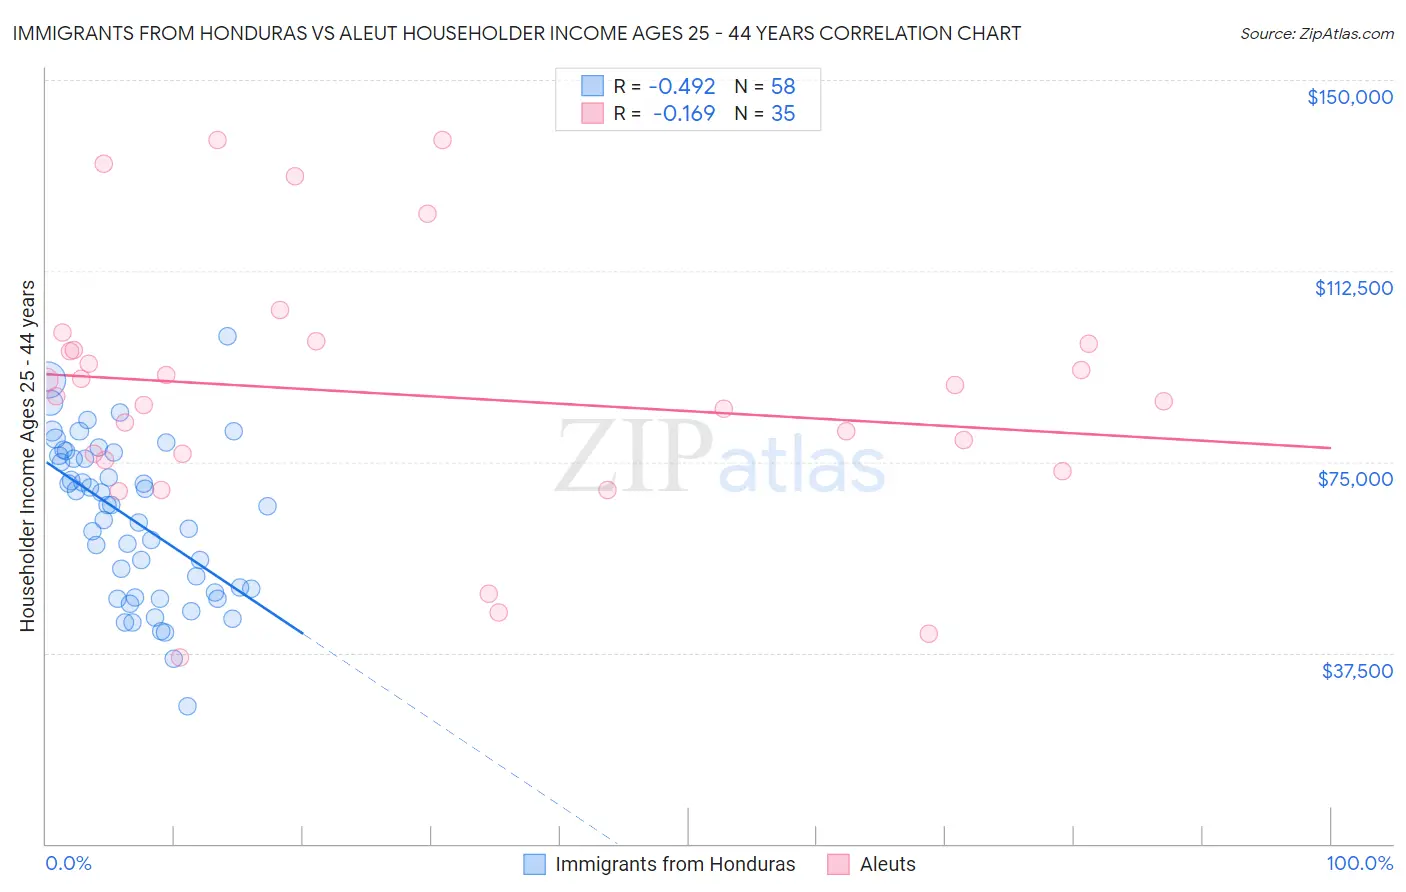
Immigrants from Honduras vs Aleut Householder Income Ages 25 - 44 years Correlation Chart
The statistical analysis conducted on geographies consisting of 321,952,844 people shows a moderate negative correlation between the proportion of Immigrants from Honduras and household income with householder between the ages 25 and 44 in the United States with a correlation coefficient (R) of -0.492 and weighted average of $77,328. Similarly, the statistical analysis conducted on geographies consisting of 61,739,915 people shows a poor negative correlation between the proportion of Aleuts and household income with householder between the ages 25 and 44 in the United States with a correlation coefficient (R) of -0.169 and weighted average of $91,370, a difference of 18.2%.
Householder Income Ages 25 - 44 years Correlation Summary
| Measurement | Immigrants from Honduras | Aleut |
| Minimum | $26,956 | $36,667 |
| Maximum | $99,657 | $138,313 |
| Range | $72,701 | $101,646 |
| Mean | $63,676 | $88,134 |
| Median | $66,366 | $88,006 |
| Interquartile 25% (IQ1) | $49,234 | $75,410 |
| Interquartile 75% (IQ3) | $76,183 | $98,125 |
| Interquartile Range (IQR) | $26,949 | $22,715 |
| Standard Deviation (Sample) | $15,519 | $24,944 |
| Standard Deviation (Population) | $15,385 | $24,585 |
Similar Demographics by Householder Income Ages 25 - 44 years
Demographics Similar to Immigrants from Honduras by Householder Income Ages 25 - 44 years
In terms of householder income ages 25 - 44 years, the demographic groups most similar to Immigrants from Honduras are Dutch West Indian ($77,260, a difference of 0.090%), Sioux ($77,089, a difference of 0.31%), Houma ($77,044, a difference of 0.37%), Immigrants from Bahamas ($76,910, a difference of 0.54%), and Chickasaw ($77,929, a difference of 0.78%).
| Demographics | Rating | Rank | Householder Income Ages 25 - 44 years |
| Africans | 0.0 /100 | #316 | Tragic $78,986 |
| U.S. Virgin Islanders | 0.0 /100 | #317 | Tragic $78,911 |
| Immigrants | Mexico | 0.0 /100 | #318 | Tragic $78,809 |
| Hondurans | 0.0 /100 | #319 | Tragic $78,540 |
| Choctaw | 0.0 /100 | #320 | Tragic $78,168 |
| Immigrants | Zaire | 0.0 /100 | #321 | Tragic $78,045 |
| Chickasaw | 0.0 /100 | #322 | Tragic $77,929 |
| Immigrants | Honduras | 0.0 /100 | #323 | Tragic $77,328 |
| Dutch West Indians | 0.0 /100 | #324 | Tragic $77,260 |
| Sioux | 0.0 /100 | #325 | Tragic $77,089 |
| Houma | 0.0 /100 | #326 | Tragic $77,044 |
| Immigrants | Bahamas | 0.0 /100 | #327 | Tragic $76,910 |
| Immigrants | Cuba | 0.0 /100 | #328 | Tragic $76,701 |
| Seminole | 0.0 /100 | #329 | Tragic $76,584 |
| Yakama | 0.0 /100 | #330 | Tragic $76,226 |
Demographics Similar to Aleuts by Householder Income Ages 25 - 44 years
In terms of householder income ages 25 - 44 years, the demographic groups most similar to Aleuts are Yugoslavian ($91,368, a difference of 0.0%), Immigrants from Thailand ($91,337, a difference of 0.040%), Immigrants from Eastern Africa ($91,458, a difference of 0.10%), Nepalese ($91,498, a difference of 0.14%), and Immigrants from Cambodia ($91,533, a difference of 0.18%).
| Demographics | Rating | Rank | Householder Income Ages 25 - 44 years |
| Kenyans | 16.8 /100 | #199 | Poor $91,684 |
| Whites/Caucasians | 16.7 /100 | #200 | Poor $91,668 |
| Japanese | 16.4 /100 | #201 | Poor $91,624 |
| Ecuadorians | 16.0 /100 | #202 | Poor $91,574 |
| Immigrants | Cambodia | 15.7 /100 | #203 | Poor $91,533 |
| Nepalese | 15.4 /100 | #204 | Poor $91,498 |
| Immigrants | Eastern Africa | 15.2 /100 | #205 | Poor $91,458 |
| Aleuts | 14.5 /100 | #206 | Poor $91,370 |
| Yugoslavians | 14.5 /100 | #207 | Poor $91,368 |
| Immigrants | Thailand | 14.3 /100 | #208 | Poor $91,337 |
| Immigrants | Uruguay | 13.2 /100 | #209 | Poor $91,171 |
| Immigrants | Kenya | 10.9 /100 | #210 | Poor $90,767 |
| Iraqis | 10.8 /100 | #211 | Poor $90,764 |
| Hawaiians | 10.6 /100 | #212 | Poor $90,722 |
| Immigrants | Bangladesh | 9.3 /100 | #213 | Tragic $90,448 |