Tongan vs Aleut Disability Age 5 to 17
COMPARE
Tongan
Aleut
Disability Age 5 to 17
Disability Age 5 to 17 Comparison
Tongans
Aleuts
5.0%
DISABILITY AGE 5 TO 17
100.0/ 100
METRIC RATING
45th/ 347
METRIC RANK
5.3%
DISABILITY AGE 5 TO 17
97.8/ 100
METRIC RATING
113th/ 347
METRIC RANK
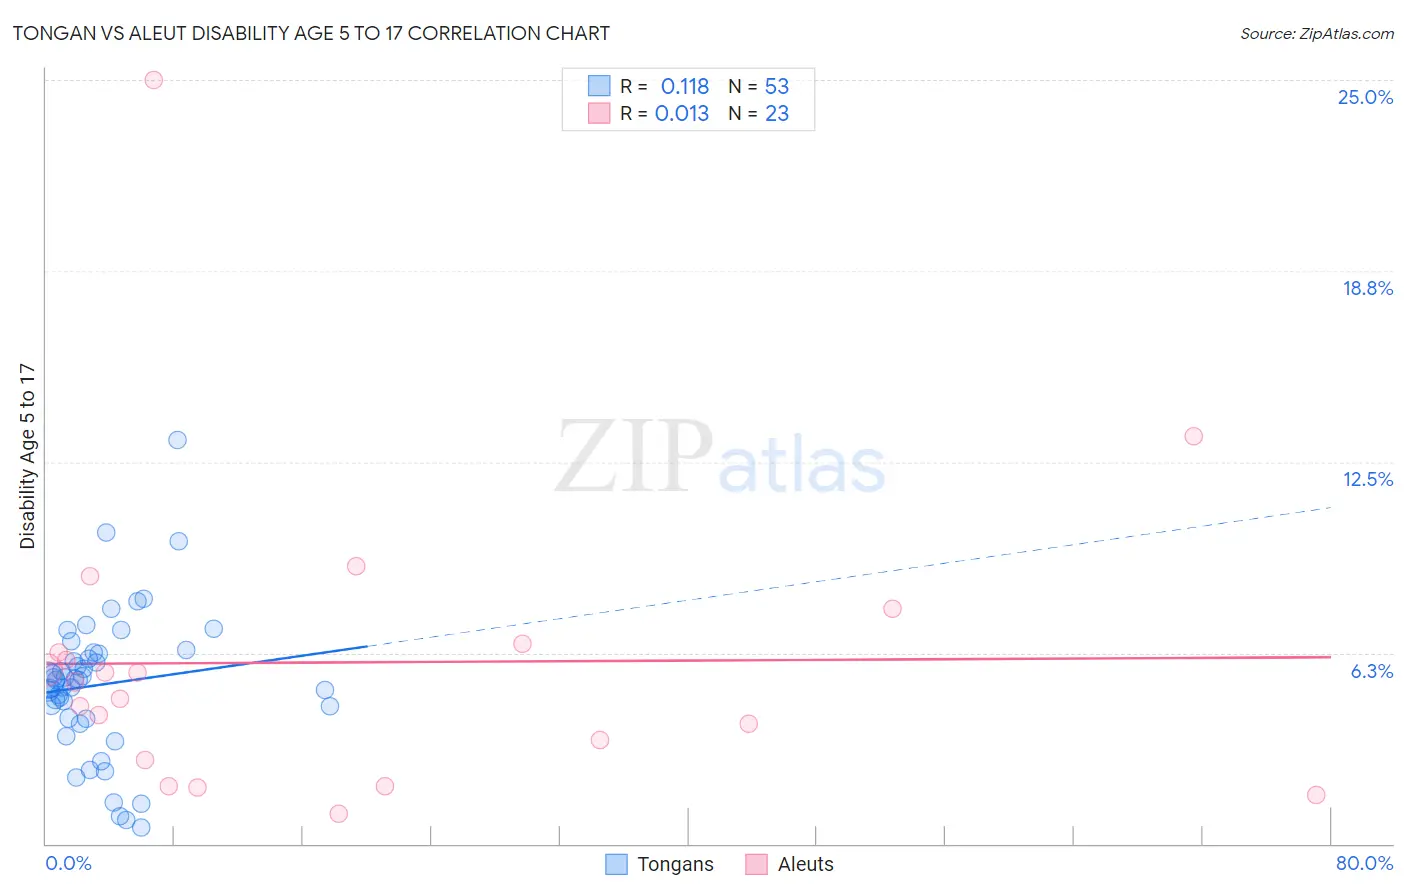
Tongan vs Aleut Disability Age 5 to 17 Correlation Chart
The statistical analysis conducted on geographies consisting of 102,679,280 people shows a poor positive correlation between the proportion of Tongans and percentage of population with a disability between the ages 5 and 17 in the United States with a correlation coefficient (R) of 0.118 and weighted average of 5.0%. Similarly, the statistical analysis conducted on geographies consisting of 61,654,039 people shows no correlation between the proportion of Aleuts and percentage of population with a disability between the ages 5 and 17 in the United States with a correlation coefficient (R) of 0.013 and weighted average of 5.3%, a difference of 5.8%.
Disability Age 5 to 17 Correlation Summary
| Measurement | Tongan | Aleut |
| Minimum | 0.54% | 0.99% |
| Maximum | 13.2% | 25.0% |
| Range | 12.7% | 24.0% |
| Mean | 5.2% | 5.9% |
| Median | 5.4% | 5.3% |
| Interquartile 25% (IQ1) | 4.1% | 2.7% |
| Interquartile 75% (IQ3) | 6.2% | 6.6% |
| Interquartile Range (IQR) | 2.1% | 3.8% |
| Standard Deviation (Sample) | 2.4% | 5.0% |
| Standard Deviation (Population) | 2.3% | 4.9% |
Similar Demographics by Disability Age 5 to 17
Demographics Similar to Tongans by Disability Age 5 to 17
In terms of disability age 5 to 17, the demographic groups most similar to Tongans are Egyptian (5.0%, a difference of 0.070%), Assyrian/Chaldean/Syriac (5.0%, a difference of 0.070%), Immigrants from Russia (5.0%, a difference of 0.11%), Vietnamese (5.1%, a difference of 0.19%), and Korean (5.1%, a difference of 0.38%).
| Demographics | Rating | Rank | Disability Age 5 to 17 |
| Immigrants | Philippines | 100.0 /100 | #38 | Exceptional 5.0% |
| Immigrants | Argentina | 100.0 /100 | #39 | Exceptional 5.0% |
| Okinawans | 100.0 /100 | #40 | Exceptional 5.0% |
| Immigrants | Australia | 100.0 /100 | #41 | Exceptional 5.0% |
| Immigrants | Sri Lanka | 100.0 /100 | #42 | Exceptional 5.0% |
| Immigrants | Russia | 100.0 /100 | #43 | Exceptional 5.0% |
| Egyptians | 100.0 /100 | #44 | Exceptional 5.0% |
| Tongans | 100.0 /100 | #45 | Exceptional 5.0% |
| Assyrians/Chaldeans/Syriacs | 100.0 /100 | #46 | Exceptional 5.0% |
| Vietnamese | 100.0 /100 | #47 | Exceptional 5.1% |
| Koreans | 100.0 /100 | #48 | Exceptional 5.1% |
| Immigrants | Western Asia | 100.0 /100 | #49 | Exceptional 5.1% |
| Argentineans | 99.9 /100 | #50 | Exceptional 5.1% |
| Turks | 99.9 /100 | #51 | Exceptional 5.1% |
| Immigrants | Fiji | 99.9 /100 | #52 | Exceptional 5.1% |
Demographics Similar to Aleuts by Disability Age 5 to 17
In terms of disability age 5 to 17, the demographic groups most similar to Aleuts are Immigrants from Northern Europe (5.3%, a difference of 0.020%), Immigrants from Latvia (5.3%, a difference of 0.040%), Cuban (5.3%, a difference of 0.040%), Ethiopian (5.3%, a difference of 0.060%), and Immigrants from Eritrea (5.3%, a difference of 0.10%).
| Demographics | Rating | Rank | Disability Age 5 to 17 |
| Immigrants | Yemen | 98.2 /100 | #106 | Exceptional 5.3% |
| Russians | 98.2 /100 | #107 | Exceptional 5.3% |
| Immigrants | South Africa | 98.1 /100 | #108 | Exceptional 5.3% |
| Immigrants | Northern Africa | 98.1 /100 | #109 | Exceptional 5.3% |
| Immigrants | Eritrea | 98.0 /100 | #110 | Exceptional 5.3% |
| Ethiopians | 97.9 /100 | #111 | Exceptional 5.3% |
| Immigrants | Latvia | 97.9 /100 | #112 | Exceptional 5.3% |
| Aleuts | 97.8 /100 | #113 | Exceptional 5.3% |
| Immigrants | Northern Europe | 97.8 /100 | #114 | Exceptional 5.3% |
| Cubans | 97.8 /100 | #115 | Exceptional 5.3% |
| Cypriots | 97.7 /100 | #116 | Exceptional 5.3% |
| Immigrants | Afghanistan | 97.4 /100 | #117 | Exceptional 5.3% |
| South Americans | 97.1 /100 | #118 | Exceptional 5.4% |
| Immigrants | South America | 97.1 /100 | #119 | Exceptional 5.4% |
| Immigrants | Immigrants | 97.0 /100 | #120 | Exceptional 5.4% |