Immigrants from Guyana vs Panamanian Self-Care Disability
COMPARE
Immigrants from Guyana
Panamanian
Self-Care Disability
Self-Care Disability Comparison
Immigrants from Guyana
Panamanians
2.8%
SELF-CARE DISABILITY
0.0/ 100
METRIC RATING
299th/ 347
METRIC RANK
2.5%
SELF-CARE DISABILITY
6.4/ 100
METRIC RATING
210th/ 347
METRIC RANK
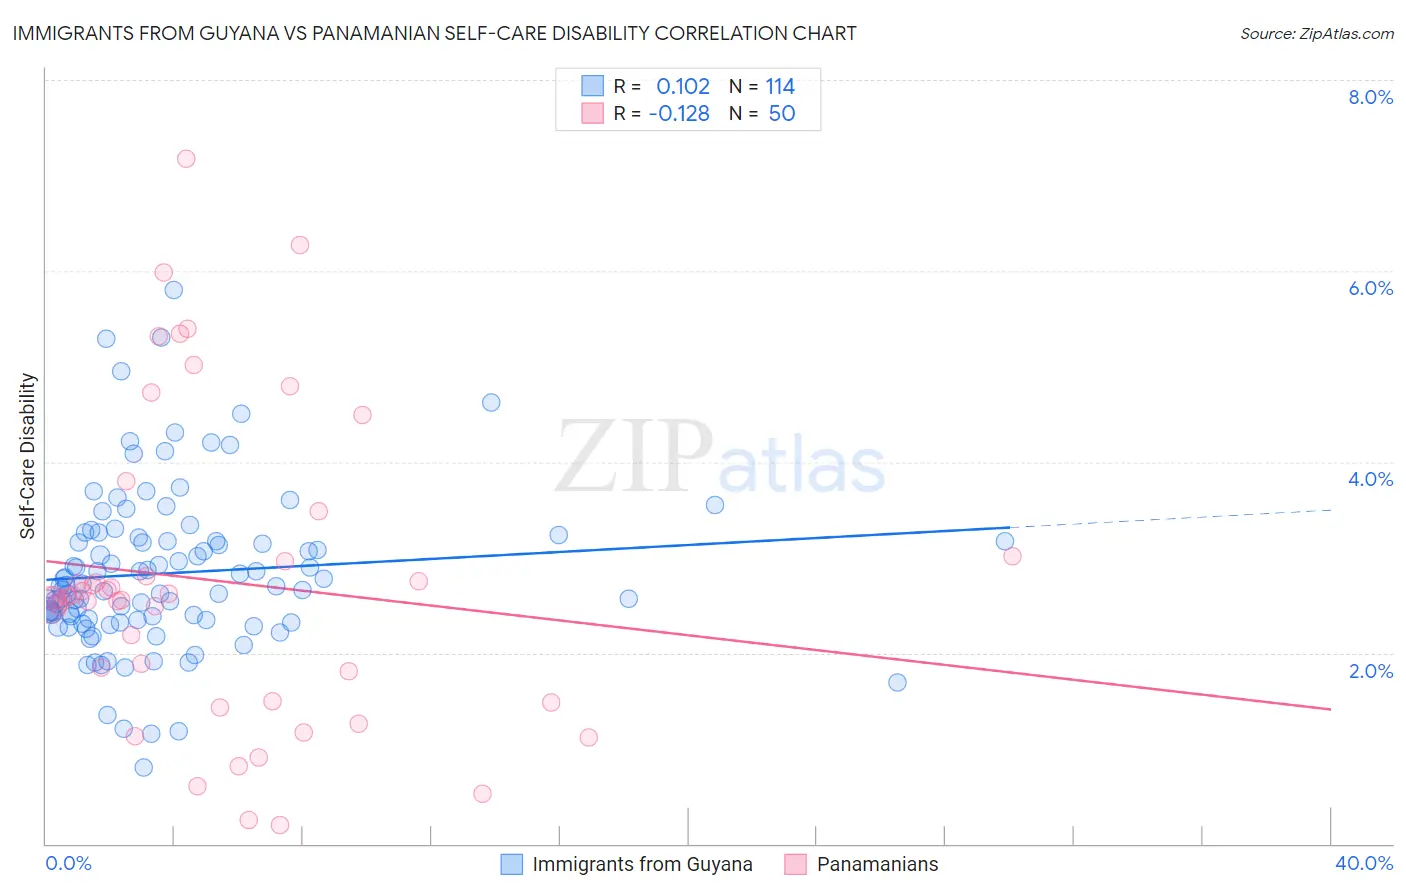
Immigrants from Guyana vs Panamanian Self-Care Disability Correlation Chart
The statistical analysis conducted on geographies consisting of 183,590,282 people shows a poor positive correlation between the proportion of Immigrants from Guyana and percentage of population with self-care disability in the United States with a correlation coefficient (R) of 0.102 and weighted average of 2.8%. Similarly, the statistical analysis conducted on geographies consisting of 280,994,783 people shows a poor negative correlation between the proportion of Panamanians and percentage of population with self-care disability in the United States with a correlation coefficient (R) of -0.128 and weighted average of 2.5%, a difference of 8.7%.
Self-Care Disability Correlation Summary
| Measurement | Immigrants from Guyana | Panamanian |
| Minimum | 0.80% | 0.20% |
| Maximum | 5.8% | 7.2% |
| Range | 5.0% | 7.0% |
| Mean | 2.8% | 2.8% |
| Median | 2.7% | 2.6% |
| Interquartile 25% (IQ1) | 2.3% | 1.5% |
| Interquartile 75% (IQ3) | 3.2% | 3.0% |
| Interquartile Range (IQR) | 0.83% | 1.5% |
| Standard Deviation (Sample) | 0.85% | 1.6% |
| Standard Deviation (Population) | 0.84% | 1.6% |
Similar Demographics by Self-Care Disability
Demographics Similar to Immigrants from Guyana by Self-Care Disability
In terms of self-care disability, the demographic groups most similar to Immigrants from Guyana are American (2.8%, a difference of 0.090%), West Indian (2.8%, a difference of 0.21%), Immigrants from Portugal (2.8%, a difference of 0.29%), Immigrants from Fiji (2.8%, a difference of 0.47%), and Pima (2.8%, a difference of 0.56%).
| Demographics | Rating | Rank | Self-Care Disability |
| Central American Indians | 0.0 /100 | #292 | Tragic 2.7% |
| Belizeans | 0.0 /100 | #293 | Tragic 2.7% |
| Blackfeet | 0.0 /100 | #294 | Tragic 2.7% |
| Barbadians | 0.0 /100 | #295 | Tragic 2.7% |
| Immigrants | Portugal | 0.0 /100 | #296 | Tragic 2.8% |
| West Indians | 0.0 /100 | #297 | Tragic 2.8% |
| Americans | 0.0 /100 | #298 | Tragic 2.8% |
| Immigrants | Guyana | 0.0 /100 | #299 | Tragic 2.8% |
| Immigrants | Fiji | 0.0 /100 | #300 | Tragic 2.8% |
| Pima | 0.0 /100 | #301 | Tragic 2.8% |
| Immigrants | St. Vincent and the Grenadines | 0.0 /100 | #302 | Tragic 2.8% |
| Immigrants | Belize | 0.0 /100 | #303 | Tragic 2.8% |
| Cree | 0.0 /100 | #304 | Tragic 2.8% |
| Immigrants | West Indies | 0.0 /100 | #305 | Tragic 2.8% |
| Aleuts | 0.0 /100 | #306 | Tragic 2.8% |
Demographics Similar to Panamanians by Self-Care Disability
In terms of self-care disability, the demographic groups most similar to Panamanians are Malaysian (2.5%, a difference of 0.23%), Native Hawaiian (2.6%, a difference of 0.27%), Samoan (2.6%, a difference of 0.29%), Central American (2.5%, a difference of 0.38%), and Ecuadorian (2.6%, a difference of 0.39%).
| Demographics | Rating | Rank | Self-Care Disability |
| Immigrants | Lebanon | 12.4 /100 | #203 | Poor 2.5% |
| Immigrants | Bahamas | 11.9 /100 | #204 | Poor 2.5% |
| Immigrants | Russia | 11.0 /100 | #205 | Poor 2.5% |
| Alaskan Athabascans | 10.4 /100 | #206 | Poor 2.5% |
| French | 9.9 /100 | #207 | Tragic 2.5% |
| Central Americans | 8.7 /100 | #208 | Tragic 2.5% |
| Malaysians | 7.7 /100 | #209 | Tragic 2.5% |
| Panamanians | 6.4 /100 | #210 | Tragic 2.5% |
| Native Hawaiians | 5.1 /100 | #211 | Tragic 2.6% |
| Samoans | 5.1 /100 | #212 | Tragic 2.6% |
| Ecuadorians | 4.7 /100 | #213 | Tragic 2.6% |
| Immigrants | Honduras | 4.7 /100 | #214 | Tragic 2.6% |
| Immigrants | Thailand | 4.5 /100 | #215 | Tragic 2.6% |
| Whites/Caucasians | 4.4 /100 | #216 | Tragic 2.6% |
| Celtics | 4.4 /100 | #217 | Tragic 2.6% |