Immigrants from Guyana vs Northern European Self-Care Disability
COMPARE
Immigrants from Guyana
Northern European
Self-Care Disability
Self-Care Disability Comparison
Immigrants from Guyana
Northern Europeans
2.8%
SELF-CARE DISABILITY
0.0/ 100
METRIC RATING
299th/ 347
METRIC RANK
2.4%
SELF-CARE DISABILITY
92.9/ 100
METRIC RATING
116th/ 347
METRIC RANK
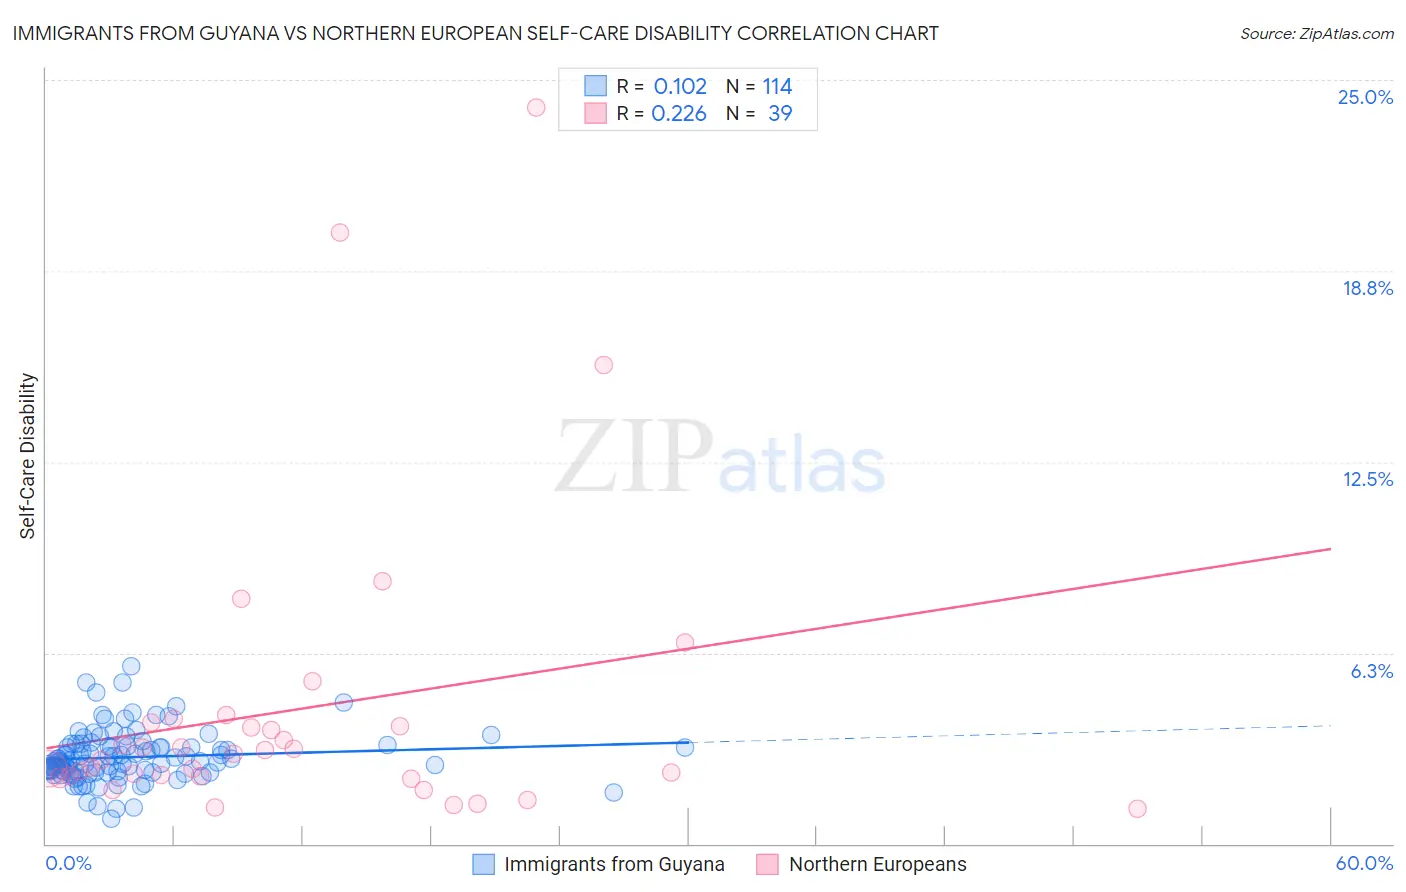
Immigrants from Guyana vs Northern European Self-Care Disability Correlation Chart
The statistical analysis conducted on geographies consisting of 183,590,282 people shows a poor positive correlation between the proportion of Immigrants from Guyana and percentage of population with self-care disability in the United States with a correlation coefficient (R) of 0.102 and weighted average of 2.8%. Similarly, the statistical analysis conducted on geographies consisting of 405,623,897 people shows a weak positive correlation between the proportion of Northern Europeans and percentage of population with self-care disability in the United States with a correlation coefficient (R) of 0.226 and weighted average of 2.4%, a difference of 15.7%.
Self-Care Disability Correlation Summary
| Measurement | Immigrants from Guyana | Northern European |
| Minimum | 0.80% | 1.2% |
| Maximum | 5.8% | 24.1% |
| Range | 5.0% | 22.9% |
| Mean | 2.8% | 4.4% |
| Median | 2.7% | 3.0% |
| Interquartile 25% (IQ1) | 2.3% | 2.2% |
| Interquartile 75% (IQ3) | 3.2% | 4.0% |
| Interquartile Range (IQR) | 0.83% | 1.8% |
| Standard Deviation (Sample) | 0.85% | 4.9% |
| Standard Deviation (Population) | 0.84% | 4.9% |
Similar Demographics by Self-Care Disability
Demographics Similar to Immigrants from Guyana by Self-Care Disability
In terms of self-care disability, the demographic groups most similar to Immigrants from Guyana are American (2.8%, a difference of 0.090%), West Indian (2.8%, a difference of 0.21%), Immigrants from Portugal (2.8%, a difference of 0.29%), Immigrants from Fiji (2.8%, a difference of 0.47%), and Pima (2.8%, a difference of 0.56%).
| Demographics | Rating | Rank | Self-Care Disability |
| Central American Indians | 0.0 /100 | #292 | Tragic 2.7% |
| Belizeans | 0.0 /100 | #293 | Tragic 2.7% |
| Blackfeet | 0.0 /100 | #294 | Tragic 2.7% |
| Barbadians | 0.0 /100 | #295 | Tragic 2.7% |
| Immigrants | Portugal | 0.0 /100 | #296 | Tragic 2.8% |
| West Indians | 0.0 /100 | #297 | Tragic 2.8% |
| Americans | 0.0 /100 | #298 | Tragic 2.8% |
| Immigrants | Guyana | 0.0 /100 | #299 | Tragic 2.8% |
| Immigrants | Fiji | 0.0 /100 | #300 | Tragic 2.8% |
| Pima | 0.0 /100 | #301 | Tragic 2.8% |
| Immigrants | St. Vincent and the Grenadines | 0.0 /100 | #302 | Tragic 2.8% |
| Immigrants | Belize | 0.0 /100 | #303 | Tragic 2.8% |
| Cree | 0.0 /100 | #304 | Tragic 2.8% |
| Immigrants | West Indies | 0.0 /100 | #305 | Tragic 2.8% |
| Aleuts | 0.0 /100 | #306 | Tragic 2.8% |
Demographics Similar to Northern Europeans by Self-Care Disability
In terms of self-care disability, the demographic groups most similar to Northern Europeans are Immigrants from North Macedonia (2.4%, a difference of 0.050%), Immigrants from Hong Kong (2.4%, a difference of 0.050%), South American (2.4%, a difference of 0.060%), Taiwanese (2.4%, a difference of 0.060%), and Scandinavian (2.4%, a difference of 0.12%).
| Demographics | Rating | Rank | Self-Care Disability |
| Slovenes | 94.1 /100 | #109 | Exceptional 2.4% |
| Immigrants | Africa | 93.7 /100 | #110 | Exceptional 2.4% |
| Serbians | 93.6 /100 | #111 | Exceptional 2.4% |
| Scandinavians | 93.5 /100 | #112 | Exceptional 2.4% |
| South Americans | 93.2 /100 | #113 | Exceptional 2.4% |
| Immigrants | North Macedonia | 93.1 /100 | #114 | Exceptional 2.4% |
| Immigrants | Hong Kong | 93.1 /100 | #115 | Exceptional 2.4% |
| Northern Europeans | 92.9 /100 | #116 | Exceptional 2.4% |
| Taiwanese | 92.5 /100 | #117 | Exceptional 2.4% |
| Immigrants | Canada | 92.0 /100 | #118 | Exceptional 2.4% |
| Immigrants | Sierra Leone | 91.8 /100 | #119 | Exceptional 2.4% |
| Uruguayans | 91.5 /100 | #120 | Exceptional 2.4% |
| Peruvians | 91.3 /100 | #121 | Exceptional 2.4% |
| Belgians | 90.9 /100 | #122 | Exceptional 2.4% |
| Immigrants | Nigeria | 90.3 /100 | #123 | Exceptional 2.4% |