Immigrants from Guyana vs Kiowa Self-Care Disability
COMPARE
Immigrants from Guyana
Kiowa
Self-Care Disability
Self-Care Disability Comparison
Immigrants from Guyana
Kiowa
2.8%
SELF-CARE DISABILITY
0.0/ 100
METRIC RATING
299th/ 347
METRIC RANK
3.0%
SELF-CARE DISABILITY
0.0/ 100
METRIC RATING
332nd/ 347
METRIC RANK
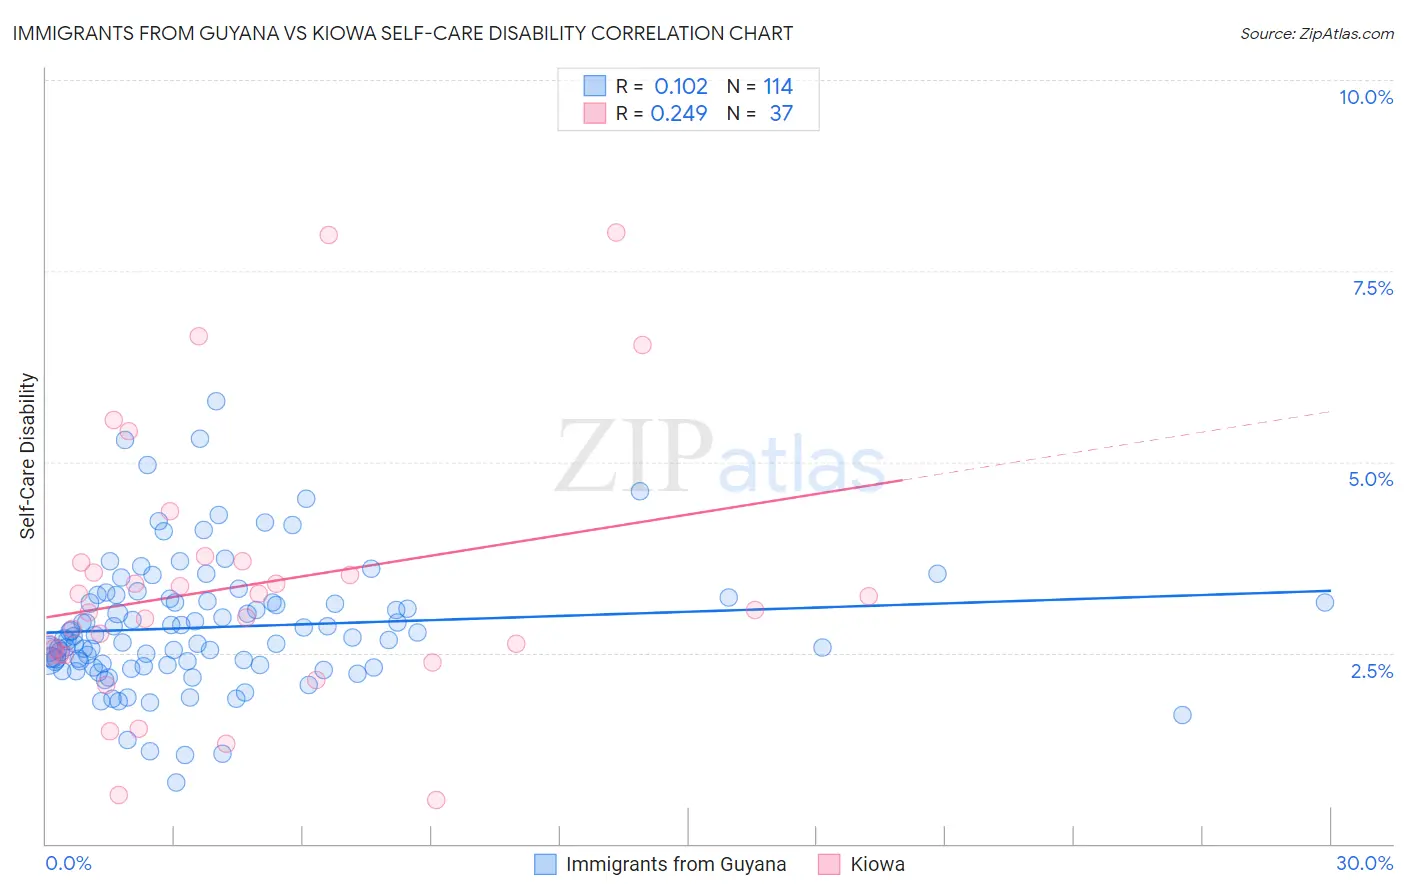
Immigrants from Guyana vs Kiowa Self-Care Disability Correlation Chart
The statistical analysis conducted on geographies consisting of 183,590,282 people shows a poor positive correlation between the proportion of Immigrants from Guyana and percentage of population with self-care disability in the United States with a correlation coefficient (R) of 0.102 and weighted average of 2.8%. Similarly, the statistical analysis conducted on geographies consisting of 56,085,215 people shows a weak positive correlation between the proportion of Kiowa and percentage of population with self-care disability in the United States with a correlation coefficient (R) of 0.249 and weighted average of 3.0%, a difference of 7.6%.
Self-Care Disability Correlation Summary
| Measurement | Immigrants from Guyana | Kiowa |
| Minimum | 0.80% | 0.57% |
| Maximum | 5.8% | 8.0% |
| Range | 5.0% | 7.4% |
| Mean | 2.8% | 3.4% |
| Median | 2.7% | 3.1% |
| Interquartile 25% (IQ1) | 2.3% | 2.5% |
| Interquartile 75% (IQ3) | 3.2% | 3.7% |
| Interquartile Range (IQR) | 0.83% | 1.2% |
| Standard Deviation (Sample) | 0.85% | 1.7% |
| Standard Deviation (Population) | 0.84% | 1.7% |
Similar Demographics by Self-Care Disability
Demographics Similar to Immigrants from Guyana by Self-Care Disability
In terms of self-care disability, the demographic groups most similar to Immigrants from Guyana are American (2.8%, a difference of 0.090%), West Indian (2.8%, a difference of 0.21%), Immigrants from Portugal (2.8%, a difference of 0.29%), Immigrants from Fiji (2.8%, a difference of 0.47%), and Pima (2.8%, a difference of 0.56%).
| Demographics | Rating | Rank | Self-Care Disability |
| Central American Indians | 0.0 /100 | #292 | Tragic 2.7% |
| Belizeans | 0.0 /100 | #293 | Tragic 2.7% |
| Blackfeet | 0.0 /100 | #294 | Tragic 2.7% |
| Barbadians | 0.0 /100 | #295 | Tragic 2.7% |
| Immigrants | Portugal | 0.0 /100 | #296 | Tragic 2.8% |
| West Indians | 0.0 /100 | #297 | Tragic 2.8% |
| Americans | 0.0 /100 | #298 | Tragic 2.8% |
| Immigrants | Guyana | 0.0 /100 | #299 | Tragic 2.8% |
| Immigrants | Fiji | 0.0 /100 | #300 | Tragic 2.8% |
| Pima | 0.0 /100 | #301 | Tragic 2.8% |
| Immigrants | St. Vincent and the Grenadines | 0.0 /100 | #302 | Tragic 2.8% |
| Immigrants | Belize | 0.0 /100 | #303 | Tragic 2.8% |
| Cree | 0.0 /100 | #304 | Tragic 2.8% |
| Immigrants | West Indies | 0.0 /100 | #305 | Tragic 2.8% |
| Aleuts | 0.0 /100 | #306 | Tragic 2.8% |
Demographics Similar to Kiowa by Self-Care Disability
In terms of self-care disability, the demographic groups most similar to Kiowa are Dutch West Indian (3.0%, a difference of 0.23%), Houma (3.0%, a difference of 0.30%), Immigrants from the Azores (3.0%, a difference of 0.35%), Lumbee (3.0%, a difference of 0.36%), and Nepalese (3.0%, a difference of 0.47%).
| Demographics | Rating | Rank | Self-Care Disability |
| Immigrants | Uzbekistan | 0.0 /100 | #325 | Tragic 2.9% |
| Paiute | 0.0 /100 | #326 | Tragic 2.9% |
| Blacks/African Americans | 0.0 /100 | #327 | Tragic 2.9% |
| Hopi | 0.0 /100 | #328 | Tragic 2.9% |
| Cajuns | 0.0 /100 | #329 | Tragic 2.9% |
| Nepalese | 0.0 /100 | #330 | Tragic 3.0% |
| Lumbee | 0.0 /100 | #331 | Tragic 3.0% |
| Kiowa | 0.0 /100 | #332 | Tragic 3.0% |
| Dutch West Indians | 0.0 /100 | #333 | Tragic 3.0% |
| Houma | 0.0 /100 | #334 | Tragic 3.0% |
| Immigrants | Azores | 0.0 /100 | #335 | Tragic 3.0% |
| Immigrants | Yemen | 0.0 /100 | #336 | Tragic 3.0% |
| Choctaw | 0.0 /100 | #337 | Tragic 3.0% |
| Cape Verdeans | 0.0 /100 | #338 | Tragic 3.0% |
| Immigrants | Dominican Republic | 0.0 /100 | #339 | Tragic 3.0% |