Immigrants from Guyana vs Menominee Self-Care Disability
COMPARE
Immigrants from Guyana
Menominee
Self-Care Disability
Self-Care Disability Comparison
Immigrants from Guyana
Menominee
2.8%
SELF-CARE DISABILITY
0.0/ 100
METRIC RATING
299th/ 347
METRIC RANK
2.8%
SELF-CARE DISABILITY
0.0/ 100
METRIC RATING
316th/ 347
METRIC RANK
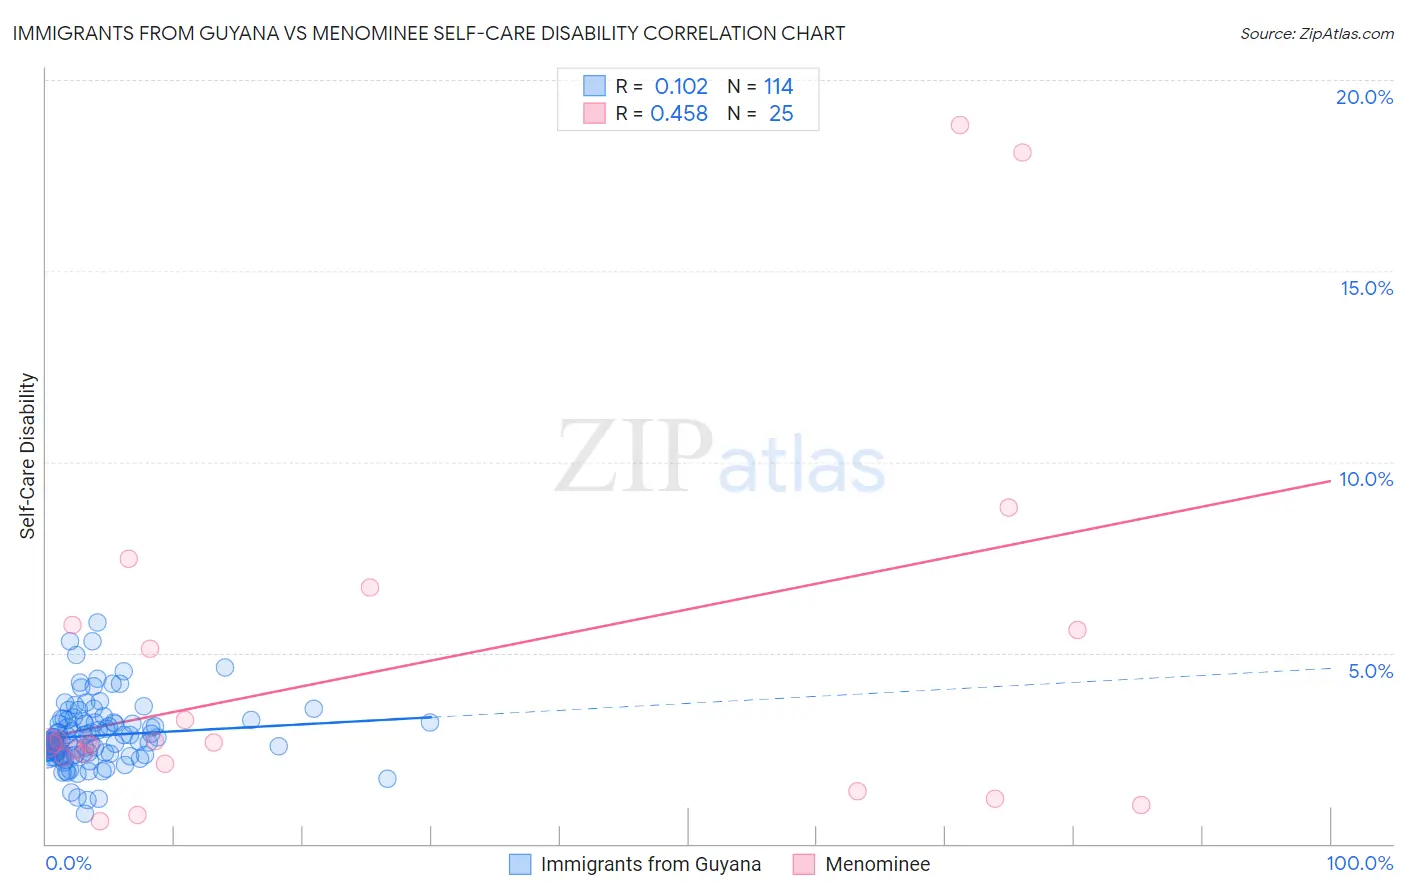
Immigrants from Guyana vs Menominee Self-Care Disability Correlation Chart
The statistical analysis conducted on geographies consisting of 183,590,282 people shows a poor positive correlation between the proportion of Immigrants from Guyana and percentage of population with self-care disability in the United States with a correlation coefficient (R) of 0.102 and weighted average of 2.8%. Similarly, the statistical analysis conducted on geographies consisting of 45,776,619 people shows a moderate positive correlation between the proportion of Menominee and percentage of population with self-care disability in the United States with a correlation coefficient (R) of 0.458 and weighted average of 2.8%, a difference of 2.8%.
Self-Care Disability Correlation Summary
| Measurement | Immigrants from Guyana | Menominee |
| Minimum | 0.80% | 0.59% |
| Maximum | 5.8% | 18.8% |
| Range | 5.0% | 18.2% |
| Mean | 2.8% | 4.5% |
| Median | 2.7% | 2.6% |
| Interquartile 25% (IQ1) | 2.3% | 2.2% |
| Interquartile 75% (IQ3) | 3.2% | 5.7% |
| Interquartile Range (IQR) | 0.83% | 3.5% |
| Standard Deviation (Sample) | 0.85% | 4.7% |
| Standard Deviation (Population) | 0.84% | 4.6% |
Demographics Similar to Immigrants from Guyana and Menominee by Self-Care Disability
In terms of self-care disability, the demographic groups most similar to Immigrants from Guyana are American (2.8%, a difference of 0.090%), West Indian (2.8%, a difference of 0.21%), Immigrants from Fiji (2.8%, a difference of 0.47%), Pima (2.8%, a difference of 0.56%), and Immigrants from St. Vincent and the Grenadines (2.8%, a difference of 0.60%). Similarly, the demographic groups most similar to Menominee are Immigrants from Cuba (2.8%, a difference of 0.10%), Immigrants from Dominica (2.8%, a difference of 0.13%), Creek (2.8%, a difference of 0.32%), Spanish American (2.8%, a difference of 0.54%), and Immigrants from Caribbean (2.8%, a difference of 0.57%).
| Demographics | Rating | Rank | Self-Care Disability |
| West Indians | 0.0 /100 | #297 | Tragic 2.8% |
| Americans | 0.0 /100 | #298 | Tragic 2.8% |
| Immigrants | Guyana | 0.0 /100 | #299 | Tragic 2.8% |
| Immigrants | Fiji | 0.0 /100 | #300 | Tragic 2.8% |
| Pima | 0.0 /100 | #301 | Tragic 2.8% |
| Immigrants | St. Vincent and the Grenadines | 0.0 /100 | #302 | Tragic 2.8% |
| Immigrants | Belize | 0.0 /100 | #303 | Tragic 2.8% |
| Cree | 0.0 /100 | #304 | Tragic 2.8% |
| Immigrants | West Indies | 0.0 /100 | #305 | Tragic 2.8% |
| Aleuts | 0.0 /100 | #306 | Tragic 2.8% |
| Natives/Alaskans | 0.0 /100 | #307 | Tragic 2.8% |
| Immigrants | Grenada | 0.0 /100 | #308 | Tragic 2.8% |
| Bangladeshis | 0.0 /100 | #309 | Tragic 2.8% |
| British West Indians | 0.0 /100 | #310 | Tragic 2.8% |
| Puget Sound Salish | 0.0 /100 | #311 | Tragic 2.8% |
| Immigrants | Caribbean | 0.0 /100 | #312 | Tragic 2.8% |
| Spanish Americans | 0.0 /100 | #313 | Tragic 2.8% |
| Creek | 0.0 /100 | #314 | Tragic 2.8% |
| Immigrants | Cuba | 0.0 /100 | #315 | Tragic 2.8% |
| Menominee | 0.0 /100 | #316 | Tragic 2.8% |
| Immigrants | Dominica | 0.0 /100 | #317 | Tragic 2.8% |