Immigrants from Ethiopia vs Immigrants from Congo Disability
COMPARE
Immigrants from Ethiopia
Immigrants from Congo
Disability
Disability Comparison
Immigrants from Ethiopia
Immigrants from Congo
10.7%
DISABILITY
100.0/ 100
METRIC RATING
34th/ 347
METRIC RANK
12.2%
DISABILITY
1.9/ 100
METRIC RATING
237th/ 347
METRIC RANK
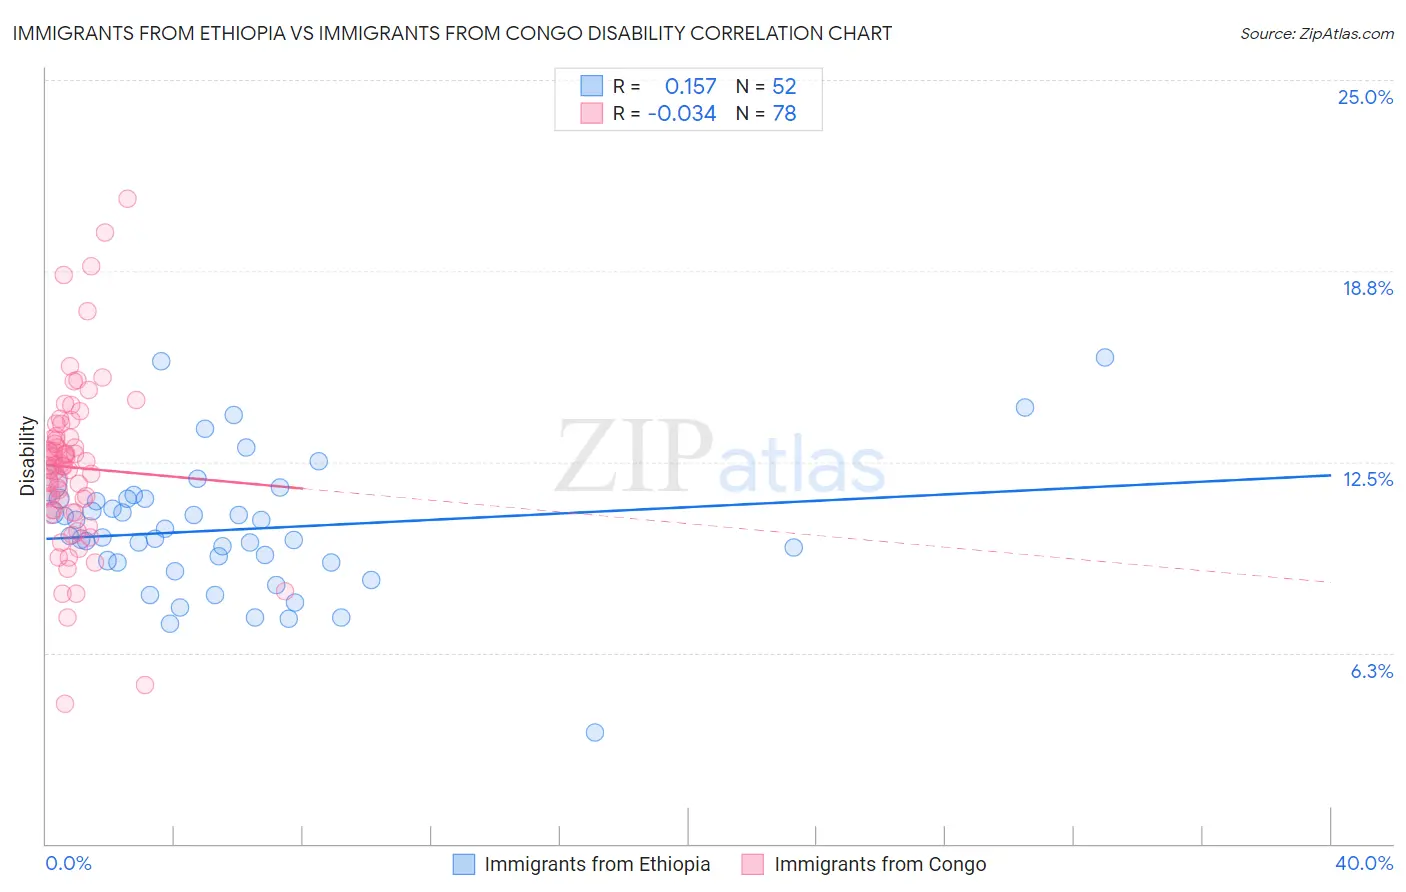
Immigrants from Ethiopia vs Immigrants from Congo Disability Correlation Chart
The statistical analysis conducted on geographies consisting of 211,552,130 people shows a poor positive correlation between the proportion of Immigrants from Ethiopia and percentage of population with a disability in the United States with a correlation coefficient (R) of 0.157 and weighted average of 10.7%. Similarly, the statistical analysis conducted on geographies consisting of 92,123,108 people shows no correlation between the proportion of Immigrants from Congo and percentage of population with a disability in the United States with a correlation coefficient (R) of -0.034 and weighted average of 12.2%, a difference of 14.1%.
Disability Correlation Summary
| Measurement | Immigrants from Ethiopia | Immigrants from Congo |
| Minimum | 3.7% | 4.6% |
| Maximum | 15.9% | 21.1% |
| Range | 12.3% | 16.5% |
| Mean | 10.3% | 12.3% |
| Median | 10.0% | 12.4% |
| Interquartile 25% (IQ1) | 9.2% | 10.9% |
| Interquartile 75% (IQ3) | 11.3% | 13.3% |
| Interquartile Range (IQR) | 2.1% | 2.4% |
| Standard Deviation (Sample) | 2.2% | 2.8% |
| Standard Deviation (Population) | 2.2% | 2.8% |
Similar Demographics by Disability
Demographics Similar to Immigrants from Ethiopia by Disability
In terms of disability, the demographic groups most similar to Immigrants from Ethiopia are Immigrants from Indonesia (10.7%, a difference of 0.010%), Ethiopian (10.7%, a difference of 0.070%), Turkish (10.7%, a difference of 0.080%), Immigrants from Kuwait (10.7%, a difference of 0.22%), and Paraguayan (10.6%, a difference of 0.47%).
| Demographics | Rating | Rank | Disability |
| Cypriots | 100.0 /100 | #27 | Exceptional 10.6% |
| Egyptians | 100.0 /100 | #28 | Exceptional 10.6% |
| Immigrants | Argentina | 100.0 /100 | #29 | Exceptional 10.6% |
| Immigrants | Turkey | 100.0 /100 | #30 | Exceptional 10.6% |
| Immigrants | Egypt | 100.0 /100 | #31 | Exceptional 10.6% |
| Paraguayans | 100.0 /100 | #32 | Exceptional 10.6% |
| Immigrants | Kuwait | 100.0 /100 | #33 | Exceptional 10.7% |
| Immigrants | Ethiopia | 100.0 /100 | #34 | Exceptional 10.7% |
| Immigrants | Indonesia | 100.0 /100 | #35 | Exceptional 10.7% |
| Ethiopians | 100.0 /100 | #36 | Exceptional 10.7% |
| Turks | 100.0 /100 | #37 | Exceptional 10.7% |
| Afghans | 99.9 /100 | #38 | Exceptional 10.8% |
| Cambodians | 99.9 /100 | #39 | Exceptional 10.8% |
| Mongolians | 99.9 /100 | #40 | Exceptional 10.8% |
| Immigrants | Australia | 99.9 /100 | #41 | Exceptional 10.8% |
Demographics Similar to Immigrants from Congo by Disability
In terms of disability, the demographic groups most similar to Immigrants from Congo are Norwegian (12.2%, a difference of 0.040%), Chinese (12.2%, a difference of 0.050%), Swedish (12.2%, a difference of 0.080%), Hungarian (12.2%, a difference of 0.13%), and Yugoslavian (12.2%, a difference of 0.13%).
| Demographics | Rating | Rank | Disability |
| Samoans | 2.6 /100 | #230 | Tragic 12.2% |
| Malaysians | 2.5 /100 | #231 | Tragic 12.2% |
| Italians | 2.5 /100 | #232 | Tragic 12.2% |
| Bahamians | 2.3 /100 | #233 | Tragic 12.2% |
| Japanese | 2.3 /100 | #234 | Tragic 12.2% |
| Yup'ik | 2.2 /100 | #235 | Tragic 12.2% |
| Chinese | 2.0 /100 | #236 | Tragic 12.2% |
| Immigrants | Congo | 1.9 /100 | #237 | Tragic 12.2% |
| Norwegians | 1.9 /100 | #238 | Tragic 12.2% |
| Swedes | 1.8 /100 | #239 | Tragic 12.2% |
| Hungarians | 1.7 /100 | #240 | Tragic 12.2% |
| Yugoslavians | 1.7 /100 | #241 | Tragic 12.2% |
| Poles | 1.7 /100 | #242 | Tragic 12.2% |
| British | 1.5 /100 | #243 | Tragic 12.2% |
| Basques | 1.5 /100 | #244 | Tragic 12.2% |