Immigrants from Syria vs Immigrants from Congo Disability
COMPARE
Immigrants from Syria
Immigrants from Congo
Disability
Disability Comparison
Immigrants from Syria
Immigrants from Congo
11.3%
DISABILITY
94.7/ 100
METRIC RATING
114th/ 347
METRIC RANK
12.2%
DISABILITY
1.9/ 100
METRIC RATING
237th/ 347
METRIC RANK
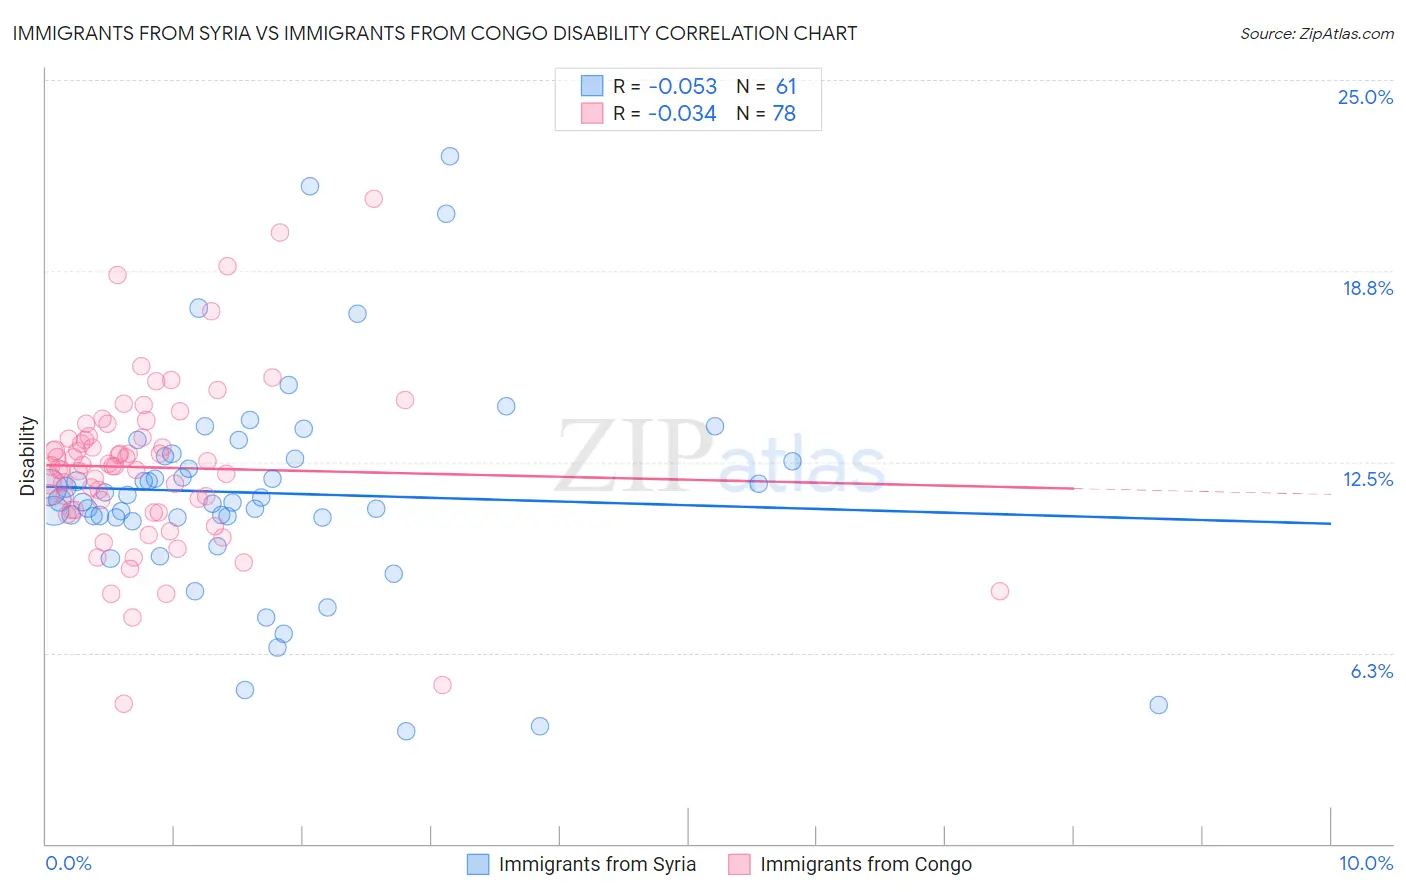
Immigrants from Syria vs Immigrants from Congo Disability Correlation Chart
The statistical analysis conducted on geographies consisting of 174,112,595 people shows a slight negative correlation between the proportion of Immigrants from Syria and percentage of population with a disability in the United States with a correlation coefficient (R) of -0.053 and weighted average of 11.3%. Similarly, the statistical analysis conducted on geographies consisting of 92,123,108 people shows no correlation between the proportion of Immigrants from Congo and percentage of population with a disability in the United States with a correlation coefficient (R) of -0.034 and weighted average of 12.2%, a difference of 7.8%.
Disability Correlation Summary
| Measurement | Immigrants from Syria | Immigrants from Congo |
| Minimum | 3.7% | 4.6% |
| Maximum | 22.5% | 21.1% |
| Range | 18.8% | 16.5% |
| Mean | 11.5% | 12.3% |
| Median | 11.3% | 12.4% |
| Interquartile 25% (IQ1) | 10.7% | 10.9% |
| Interquartile 75% (IQ3) | 12.6% | 13.3% |
| Interquartile Range (IQR) | 2.0% | 2.4% |
| Standard Deviation (Sample) | 3.5% | 2.8% |
| Standard Deviation (Population) | 3.5% | 2.8% |
Similar Demographics by Disability
Demographics Similar to Immigrants from Syria by Disability
In terms of disability, the demographic groups most similar to Immigrants from Syria are Guyanese (11.3%, a difference of 0.010%), Immigrants from Philippines (11.3%, a difference of 0.010%), Immigrants from Uzbekistan (11.3%, a difference of 0.050%), Immigrants from Northern Europe (11.3%, a difference of 0.13%), and Immigrants from South Eastern Asia (11.3%, a difference of 0.17%).
| Demographics | Rating | Rank | Disability |
| Nicaraguans | 96.2 /100 | #107 | Exceptional 11.3% |
| Immigrants | Nigeria | 96.0 /100 | #108 | Exceptional 11.3% |
| Immigrants | Uganda | 95.7 /100 | #109 | Exceptional 11.3% |
| Immigrants | Denmark | 95.6 /100 | #110 | Exceptional 11.3% |
| Immigrants | South Eastern Asia | 95.4 /100 | #111 | Exceptional 11.3% |
| Immigrants | Uzbekistan | 94.9 /100 | #112 | Exceptional 11.3% |
| Guyanese | 94.7 /100 | #113 | Exceptional 11.3% |
| Immigrants | Syria | 94.7 /100 | #114 | Exceptional 11.3% |
| Immigrants | Philippines | 94.6 /100 | #115 | Exceptional 11.3% |
| Immigrants | Northern Europe | 94.1 /100 | #116 | Exceptional 11.3% |
| Luxembourgers | 93.9 /100 | #117 | Exceptional 11.3% |
| Koreans | 93.8 /100 | #118 | Exceptional 11.3% |
| Central Americans | 93.5 /100 | #119 | Exceptional 11.4% |
| Immigrants | North Macedonia | 93.5 /100 | #120 | Exceptional 11.4% |
| Immigrants | Costa Rica | 93.4 /100 | #121 | Exceptional 11.4% |
Demographics Similar to Immigrants from Congo by Disability
In terms of disability, the demographic groups most similar to Immigrants from Congo are Norwegian (12.2%, a difference of 0.040%), Chinese (12.2%, a difference of 0.050%), Swedish (12.2%, a difference of 0.080%), Hungarian (12.2%, a difference of 0.13%), and Yugoslavian (12.2%, a difference of 0.13%).
| Demographics | Rating | Rank | Disability |
| Samoans | 2.6 /100 | #230 | Tragic 12.2% |
| Malaysians | 2.5 /100 | #231 | Tragic 12.2% |
| Italians | 2.5 /100 | #232 | Tragic 12.2% |
| Bahamians | 2.3 /100 | #233 | Tragic 12.2% |
| Japanese | 2.3 /100 | #234 | Tragic 12.2% |
| Yup'ik | 2.2 /100 | #235 | Tragic 12.2% |
| Chinese | 2.0 /100 | #236 | Tragic 12.2% |
| Immigrants | Congo | 1.9 /100 | #237 | Tragic 12.2% |
| Norwegians | 1.9 /100 | #238 | Tragic 12.2% |
| Swedes | 1.8 /100 | #239 | Tragic 12.2% |
| Hungarians | 1.7 /100 | #240 | Tragic 12.2% |
| Yugoslavians | 1.7 /100 | #241 | Tragic 12.2% |
| Poles | 1.7 /100 | #242 | Tragic 12.2% |
| British | 1.5 /100 | #243 | Tragic 12.2% |
| Basques | 1.5 /100 | #244 | Tragic 12.2% |