Immigrants from Ghana vs Yugoslavian Disability Age 5 to 17
COMPARE
Immigrants from Ghana
Yugoslavian
Disability Age 5 to 17
Disability Age 5 to 17 Comparison
Immigrants from Ghana
Yugoslavians
5.9%
DISABILITY AGE 5 TO 17
1.7/ 100
METRIC RATING
249th/ 347
METRIC RANK
5.8%
DISABILITY AGE 5 TO 17
9.1/ 100
METRIC RATING
211th/ 347
METRIC RANK
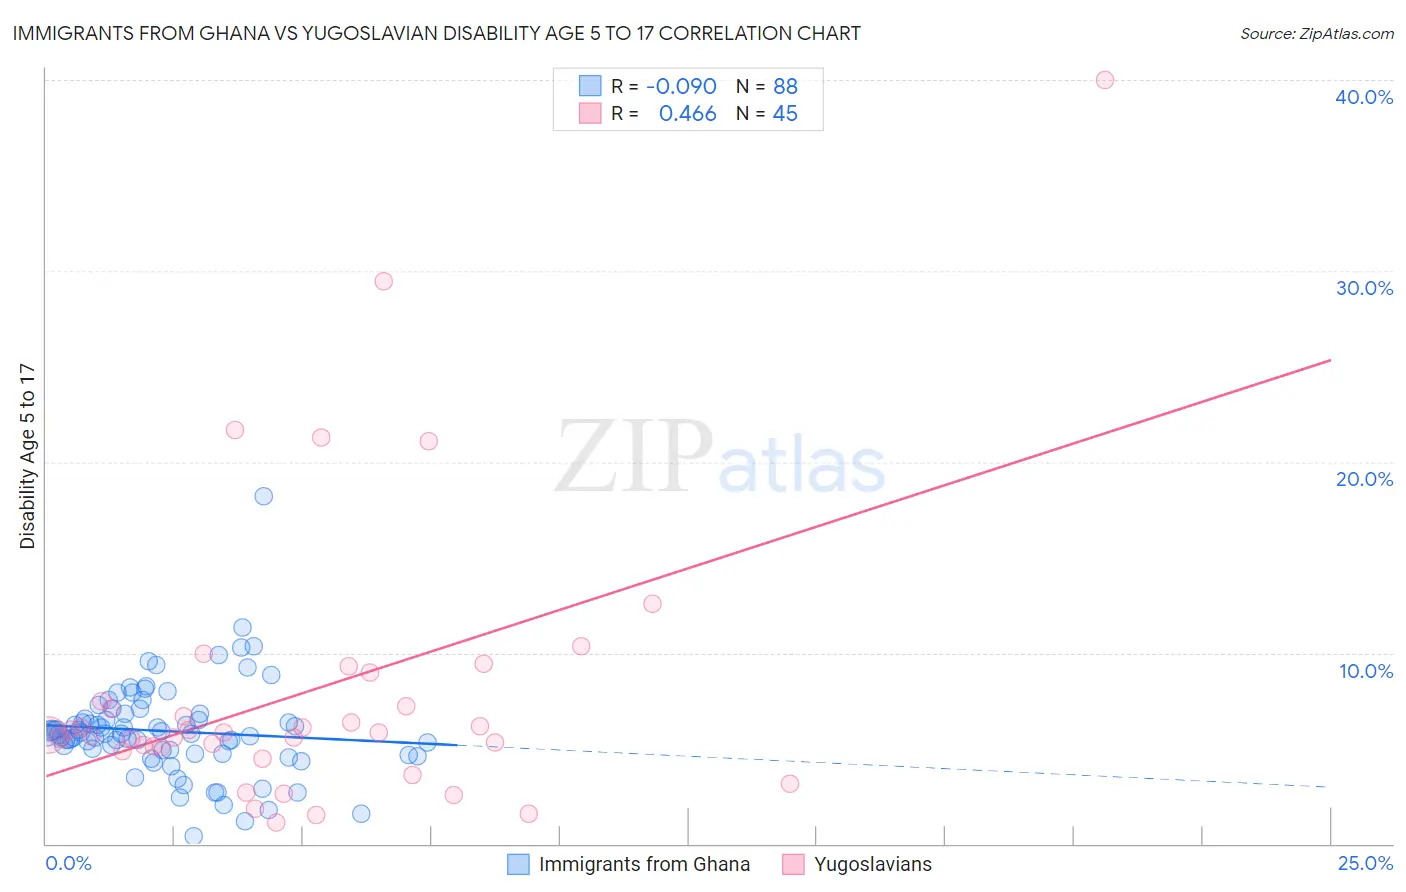
Immigrants from Ghana vs Yugoslavian Disability Age 5 to 17 Correlation Chart
The statistical analysis conducted on geographies consisting of 199,220,880 people shows a slight negative correlation between the proportion of Immigrants from Ghana and percentage of population with a disability between the ages 5 and 17 in the United States with a correlation coefficient (R) of -0.090 and weighted average of 5.9%. Similarly, the statistical analysis conducted on geographies consisting of 284,028,403 people shows a moderate positive correlation between the proportion of Yugoslavians and percentage of population with a disability between the ages 5 and 17 in the United States with a correlation coefficient (R) of 0.466 and weighted average of 5.8%, a difference of 2.1%.
Disability Age 5 to 17 Correlation Summary
| Measurement | Immigrants from Ghana | Yugoslavian |
| Minimum | 0.40% | 1.1% |
| Maximum | 18.2% | 40.0% |
| Range | 17.8% | 38.9% |
| Mean | 5.9% | 8.0% |
| Median | 5.8% | 5.8% |
| Interquartile 25% (IQ1) | 4.8% | 4.9% |
| Interquartile 75% (IQ3) | 6.7% | 8.2% |
| Interquartile Range (IQR) | 1.9% | 3.3% |
| Standard Deviation (Sample) | 2.5% | 7.5% |
| Standard Deviation (Population) | 2.4% | 7.4% |
Similar Demographics by Disability Age 5 to 17
Demographics Similar to Immigrants from Ghana by Disability Age 5 to 17
In terms of disability age 5 to 17, the demographic groups most similar to Immigrants from Ghana are British (5.9%, a difference of 0.010%), Immigrants from Honduras (5.9%, a difference of 0.090%), Immigrants from Germany (5.9%, a difference of 0.12%), Immigrants from Micronesia (5.9%, a difference of 0.12%), and Tlingit-Haida (5.9%, a difference of 0.12%).
| Demographics | Rating | Rank | Disability Age 5 to 17 |
| Spaniards | 2.0 /100 | #242 | Tragic 5.9% |
| Indonesians | 2.0 /100 | #243 | Tragic 5.9% |
| Immigrants | Germany | 1.9 /100 | #244 | Tragic 5.9% |
| Immigrants | Micronesia | 1.9 /100 | #245 | Tragic 5.9% |
| Tlingit-Haida | 1.9 /100 | #246 | Tragic 5.9% |
| Immigrants | Honduras | 1.8 /100 | #247 | Tragic 5.9% |
| British | 1.7 /100 | #248 | Tragic 5.9% |
| Immigrants | Ghana | 1.7 /100 | #249 | Tragic 5.9% |
| Poles | 1.5 /100 | #250 | Tragic 5.9% |
| Immigrants | Cambodia | 1.5 /100 | #251 | Tragic 5.9% |
| Hondurans | 1.5 /100 | #252 | Tragic 5.9% |
| Scandinavians | 1.4 /100 | #253 | Tragic 5.9% |
| Barbadians | 1.3 /100 | #254 | Tragic 5.9% |
| Italians | 1.2 /100 | #255 | Tragic 5.9% |
| Hopi | 1.0 /100 | #256 | Tragic 5.9% |
Demographics Similar to Yugoslavians by Disability Age 5 to 17
In terms of disability age 5 to 17, the demographic groups most similar to Yugoslavians are Immigrants from Haiti (5.8%, a difference of 0.050%), Immigrants from Panama (5.8%, a difference of 0.070%), Immigrants from Uganda (5.8%, a difference of 0.080%), Kenyan (5.8%, a difference of 0.12%), and Immigrants from Cameroon (5.8%, a difference of 0.12%).
| Demographics | Rating | Rank | Disability Age 5 to 17 |
| Paiute | 11.2 /100 | #204 | Poor 5.7% |
| Trinidadians and Tobagonians | 10.8 /100 | #205 | Poor 5.7% |
| Immigrants | Africa | 10.8 /100 | #206 | Poor 5.7% |
| Moroccans | 10.4 /100 | #207 | Poor 5.7% |
| Kenyans | 10.0 /100 | #208 | Poor 5.8% |
| Immigrants | Uganda | 9.7 /100 | #209 | Tragic 5.8% |
| Immigrants | Haiti | 9.5 /100 | #210 | Tragic 5.8% |
| Yugoslavians | 9.1 /100 | #211 | Tragic 5.8% |
| Immigrants | Panama | 8.7 /100 | #212 | Tragic 5.8% |
| Immigrants | Cameroon | 8.3 /100 | #213 | Tragic 5.8% |
| Immigrants | Morocco | 8.3 /100 | #214 | Tragic 5.8% |
| Swedes | 8.1 /100 | #215 | Tragic 5.8% |
| Nigerians | 7.5 /100 | #216 | Tragic 5.8% |
| Czechs | 7.4 /100 | #217 | Tragic 5.8% |
| Immigrants | Sierra Leone | 7.1 /100 | #218 | Tragic 5.8% |